On Aug 27 2014 an initial set of 5 data files have been received from Pavel Herman from the Lansner lab - Computational neuroscience and Neurocomputing, departmant of Computational Biology at KTH's school of Computer Science and Communication.
The file "synchAlpha_100s_volts1.out" contains samples of neuronal activity represented as electrical tension expressed in mV. The data set contains 100000 samples for each of 164 neuron, representing 100s of activity (i.e. the sampling frequency is 1000 Hz). The last neuron in the set has only 20000 samples – it probably has been truncated somehow.
The data has been transcoded to the TP binary data format (.tpbd) and then a first surveying audification has been performed (see code to the right). As the data are time series, one can interpret them as sound pressure level differences and listen to them by playing them through a DA converter. In the first audification the 164 clips have been concatenated and normalized in ampitude, resulting in a sound file of 6 min 10 sec when played at the sample frequency of 44.1 kHz (i.e. the data was sped up by a factor of 44.1).
Listening to the data reveils neural spikes clearly audible as clicks in the foreground against different kinds of background noise. The background noise shows different kinds of modulation (more or less periodic, more or less intense). There is a large variety of sonic qualities in the material, which seems very promissing at this stage.
Once the topology of the neurons is known, more meaningful temporal and spatial arrangement of the data can be devised.
Links to related work and background information:
http://en.wikipedia.org/wiki/Artificial_neural_network
2014 12 14, Gerhard
Unfortunately the first audification was wrong, as the data was wrongly transcoded. As a consequence, samples from different cells have been interleaved, producing very strange signals. In the meantime Pawel also reveiled that the data in the synchAlpha_100s data set consists of a simulation of 2 networks of 16 hypercolumns each. The data file synchAlpha_100s_volts1 contains the signals of 5 minicolums per hypercolum, i.e. a total of 80 cells (16 x 5). As the signals in synchAlpha_100s_volts1 are downsampled from 10 to 1 kHz by simple decimation, spikes are lost in these signals. They could be reconstructed from the synchAlpha_100s_spikes1 data file, which contains the spike times at a resolution of 0.1 ms, corresponding to the simulation sample rate of 10 kHz. The following two sounds are audifications of the 80 cells in the first and the second network, player one after the other, representing 16 groups (hypercolumns) of 5 cells (minicolum).
2014 12 18, Gerhard
Remarks on listening to the two audifications:
(1) As the cells close together in space (in a hyper-column) appear after each other, a clear correlation of the background (loop) can be heard.
(2) The background sounds of the two networks are quite different.
(3) It would be interesting to remove the spikes and listen to the backgrounds only.
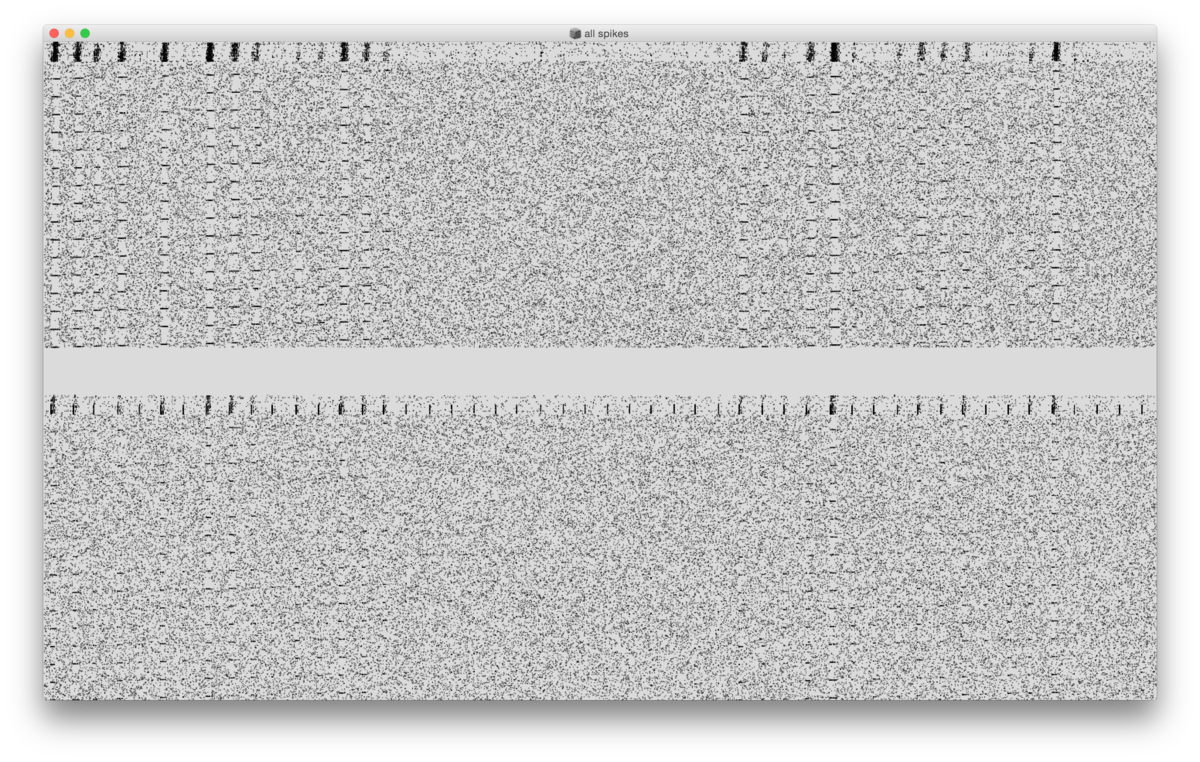
I visualized the spikes of all 30959 cells in the data set. On the y-axis the cell index is represented (0-30958) and on the x-axis time (0-100s).
~root = "~/ownCloud/TP".standardizePath;
~data = ~root +/+ "data/neuro/tpbd";
~sound = ~root +/+ "data/neuro/snd";
// load format utilities
(~root +/+ "data/format/format.scd").load;
// load dsp tools
"dsptools.scd".loadRelative;
~potentials = ~readTPBD.(~data +/+ "synchAlpha_100s_volts1");
// concatenate the samples of all neurons (in total 16320000)
~all = ~potentials[1].collect{|x| x[2]}.normalize.asSignal;
// save concatednated signal
~saveSignal.(~all, ~sound +/+ "all.aif");