Introduction
As a classical singer, I found that while our technique and theory are well founded and somewhat uniform, requirements of our emotional expression are almost exclusively based on the instructor's opinion or personal experience. This can create discrepancies between teaching methods, and even between teachers in the same method. This confusion may lead to an ineffective, sometimes completely failed education regarding emotional expression.
With my knowledge and experience in Data Science and Artificial Intelligence, I intend to slightly demystify the factors that attribute to a musician’s expression. More concretely, I want to use Data Science methods to pin-point factors which correlate with the difference between a musician’s conceived expression (the emotion the musician intends to convey), and the audience’s perceived expression (the emotion the audience ultimately experiences).
We can find numerous treatises and essays about the subject of emotion expression in rhetoric and music, whose conclusions rely more on anecdotal evidence and rationalism, rather than broad statistical or empirical research. Since the last century, we are witnessing a rise in empirical research of the subject, but almost exclusively from a psychological or commercial point of view. From the Data Science community, we see many successful experiments and insightful research on the subject. Most relevantly; researchers are able to automatically predict and analyze human emotional responses to music with higher accuracy, wider variety of input, and larger complexity.
I proposed an experiment in which I train an Artificial Neural Network to predict the perceived emotion of a human audience to a short musical phrase. While this has been done successfully before, I propose a novel model, which combines LSTM (Long Short Term Memory) and CNN (Convolutional Neural Network). I believe this previously untested approach represents more closely the way the human mind perceives music.
I then fed the trained novel model carefully curated input (such as single tones, quick dynamic changes etc.), in order to examine the factors it attributes as important for the conceived emotion, and the emotional gradient. With this I was able to examine the factors that affect the simulated audience’s emotional perception, in response to carefully isolated changes in the musical input.
While I am intrigued by the capabilities of Artificial Intelligence to predict (and maybe modify) human emotional perception, I find the questions that this topic raises to be even more interesting and relevant. I am most fascinated by the great contradiction in our inability to believe that emotions are no more than physical factors, and refusal to attribute our conscience experience to mere input and signals - yet we are determined to academically claim that one form of expression is superior, or that a certain way of expression is more effective than the other.
Research question
As artists, our biggest power is evoking emotions; yet it is the least practiced element of our craft. While we are able to use our imagination, empathy and personal experience to improve our emotional expression, our only means of testing our progress is with a live audience - test settings of which are few and far in between.
As an experienced Artificial Intelligence Algorithms engineer, and a classically trained singer, the undertested approach to expression bothered me. And thus I decided to dedicate my Master's research to exploring our understanding of emotional expression in music, using Artificial Intelligence and empirical methods.
To keep my research focused, I've formulated this research question:
What are the main quantifiable or qualitative factors which influence the difference between a musician’s emotional expression and their audience’s experience?
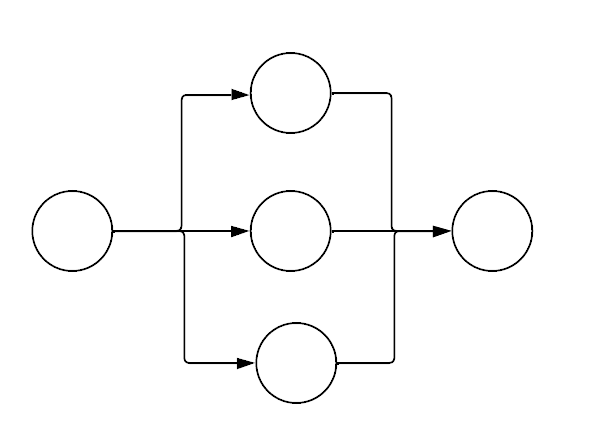
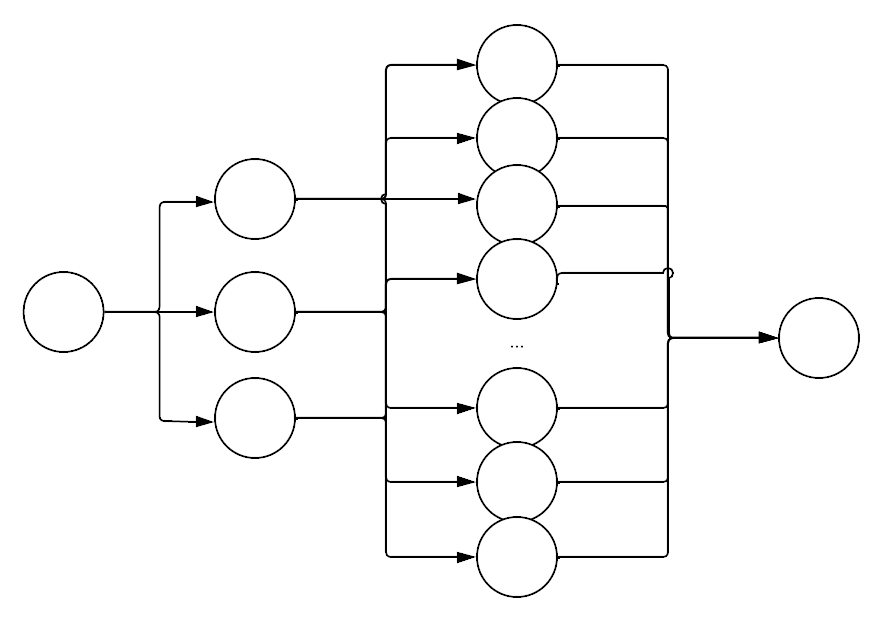
Artificial Neural Network
An Artificial Neural Network (ANN) is a software architecture based on the structure of the brain. ANNs are simply networks of nodes, sometimes called artificial neurons. The architect decides on the architecture of the network - which nodes are connected to which, and in what way (i.e. simple directional network, directional connection of node layers etc.).
Each node contains a mathematical function, and each connection holds a weight.
In order to train an ANN to solve a problem, a tagged dataset is fed into the machine, and the machine’s output is compared with the dataset’s tagging. The machine’s weights are then updated in a process called “backward propagation” based on the difference between output and tag.
With the appropriate architectures and trainsets, ANNs can be trained to solve many diverse problems such as solving differential equations, automatic translation, speech to text transcription and many many more.

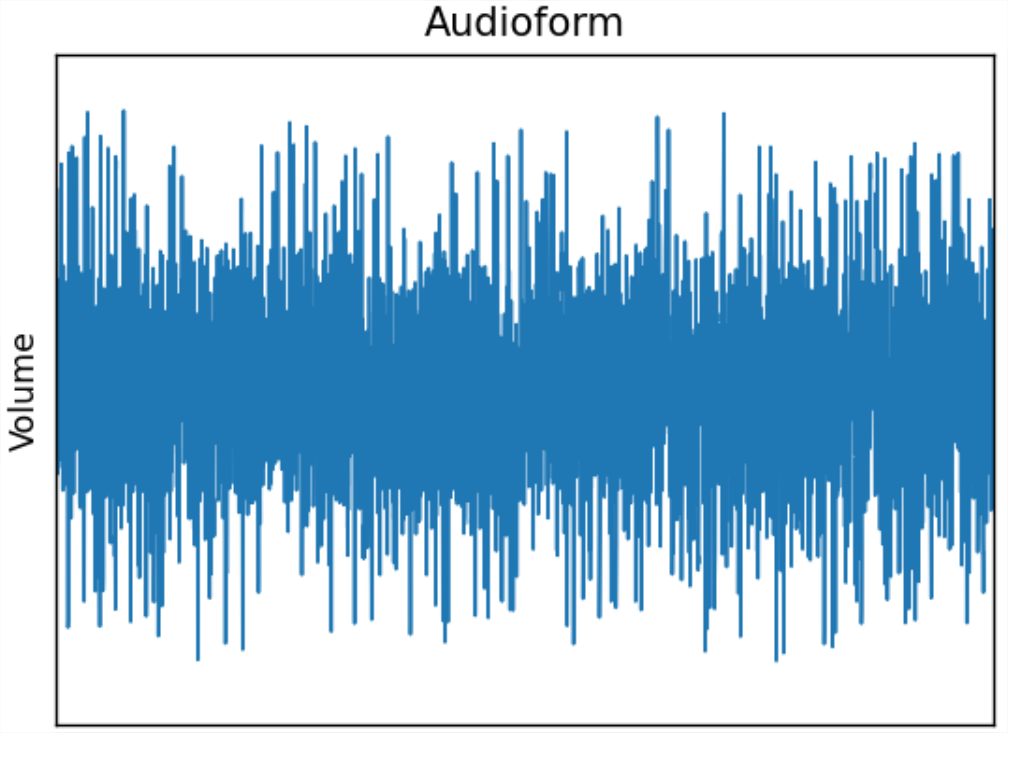
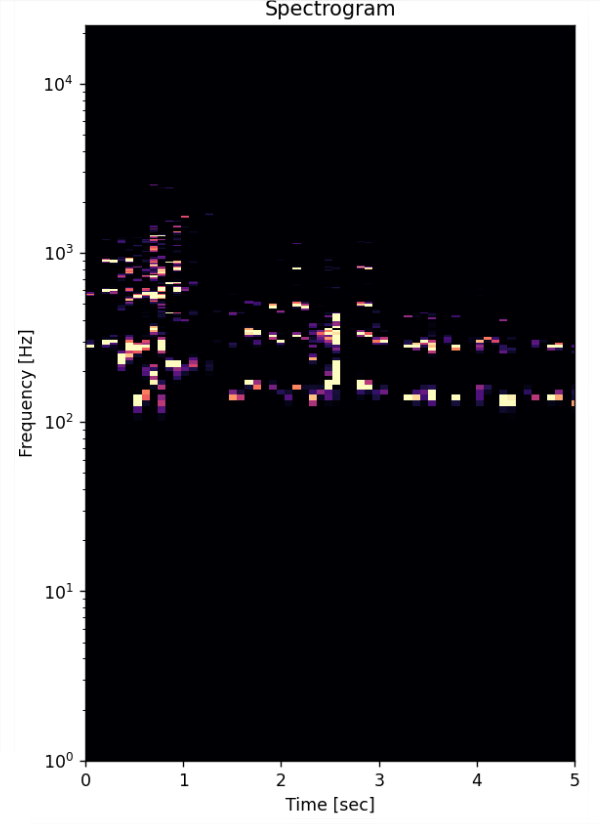
Experiment overview
This is a summarized and simplified review of the experiment done in this research.
For a deeper dive, see detailed experiment description.
Experiment results
This is a summarized and simplified review of the experiment's results.
For a deeper dive, see detailed experiment results description.
Adaptations
The scope of this research was not enough to fully explore all the possibilities of this approach. I hope the preparations I’ve made will allow future researchers to take this research into various interesting directions.
I have made all of the code and data that I’ve used available openly in this GitHub Project.
I will describe here a few possible adaptations:
Conclusions
In this research I was looking for novel empirical ways to better understand the contributing factors to our emotional experience of music. Within the scope of this research I successfully gave preliminary answers to the research question, and supplied the groundwork for follow-up research, including practical and thematic infrastructures.
The main factors contributing to our emotional experience of music, as were found in the analysis of the experiment, were:
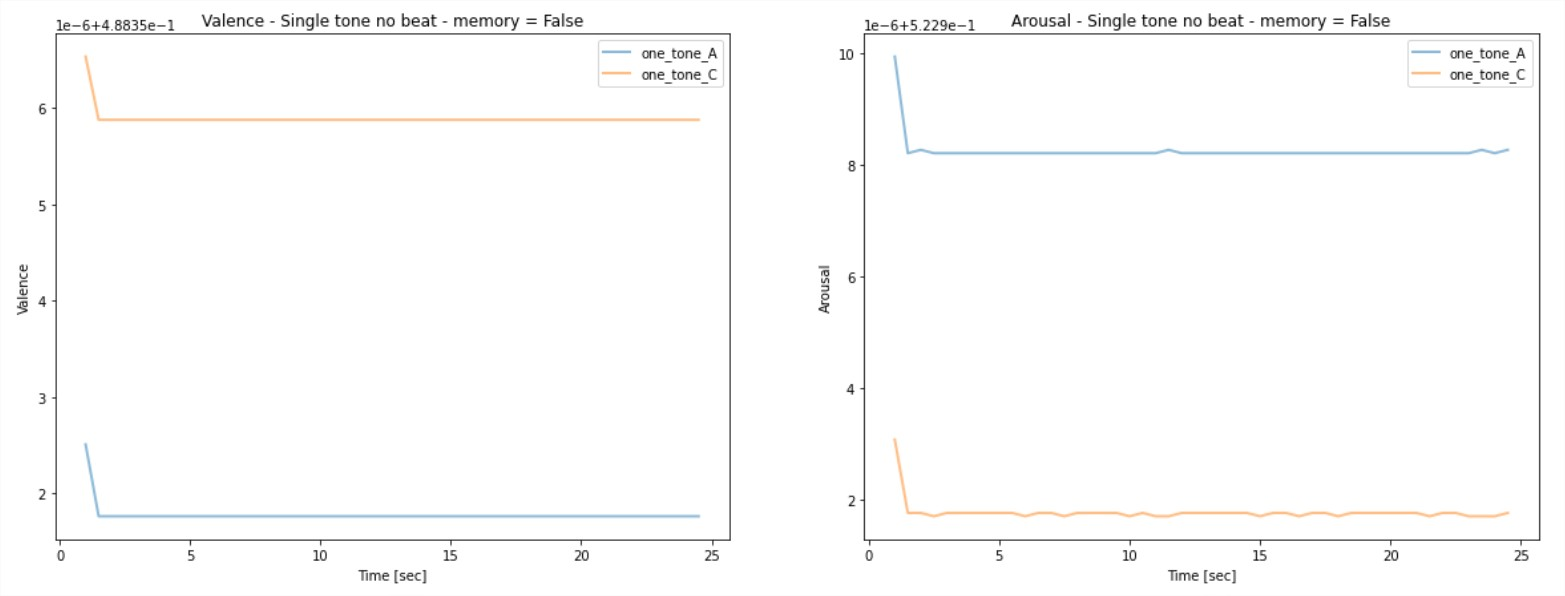
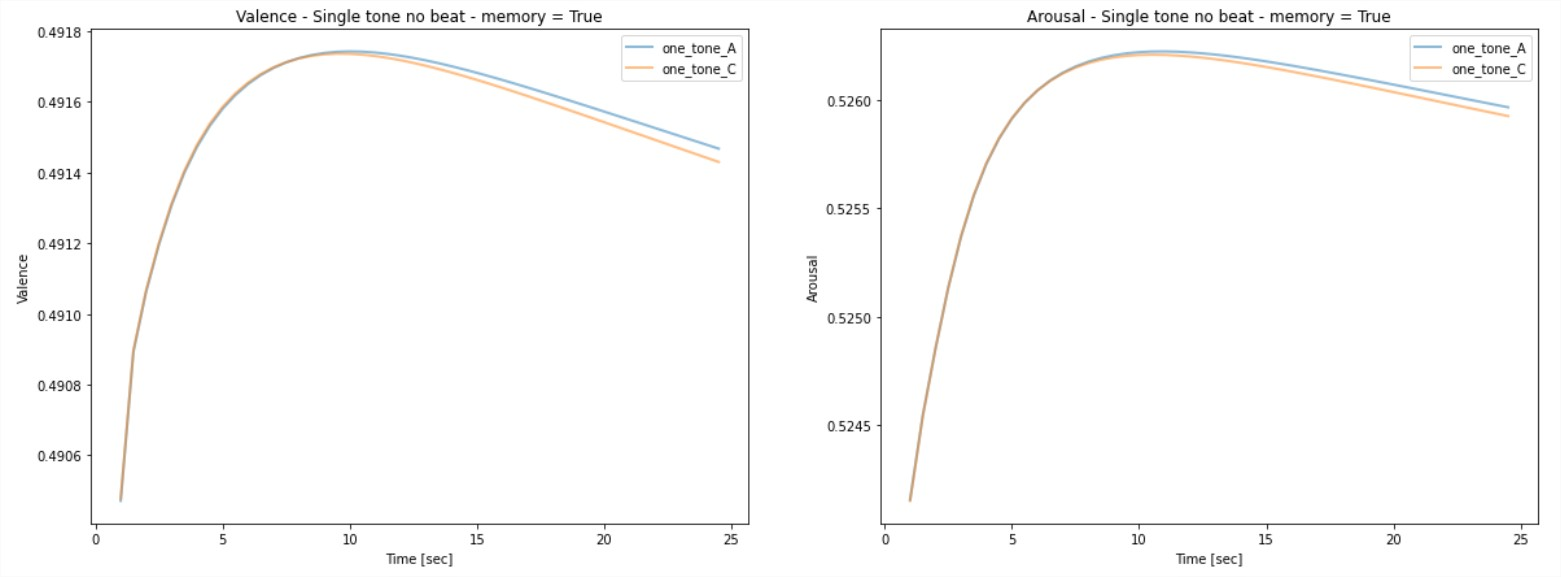
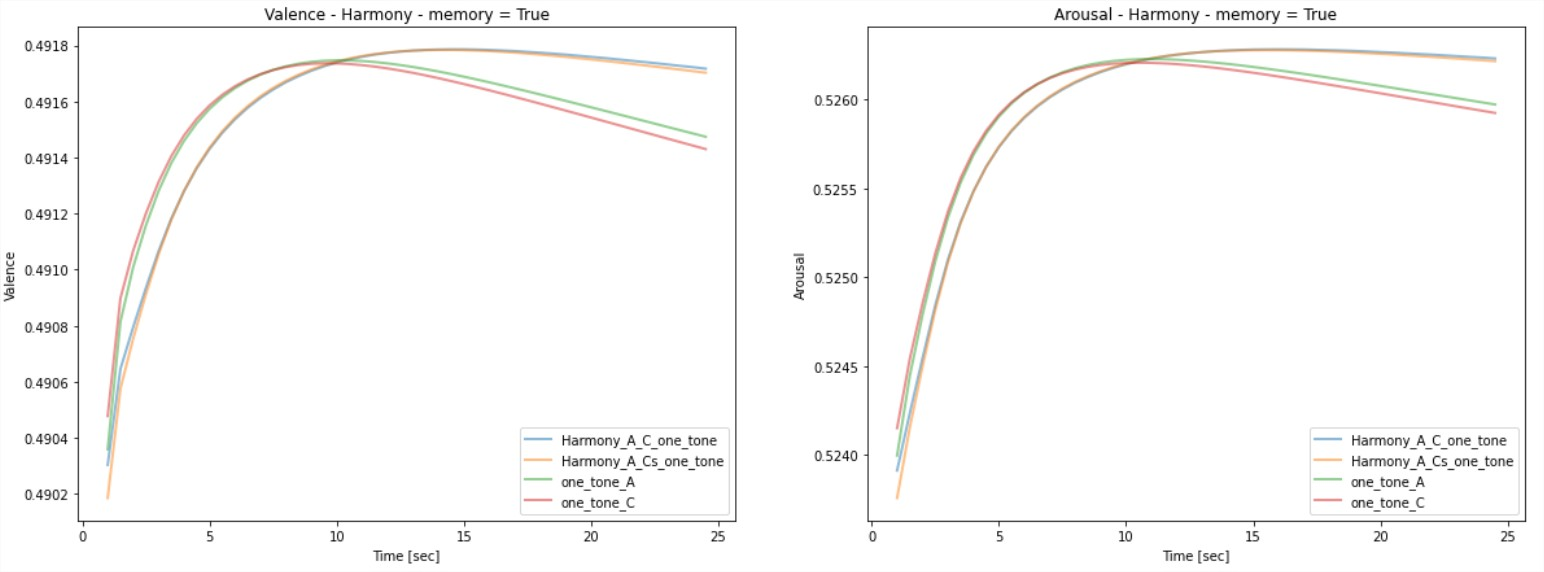
- Melodic relativity (short term memory) - whether in single pitch, single harmony, or progressions, we could clearly see a preference to change compared with sustaining. We could also see that the attention span of a sustained pitch or harmony was around 8 seconds; after which the suspense fades.
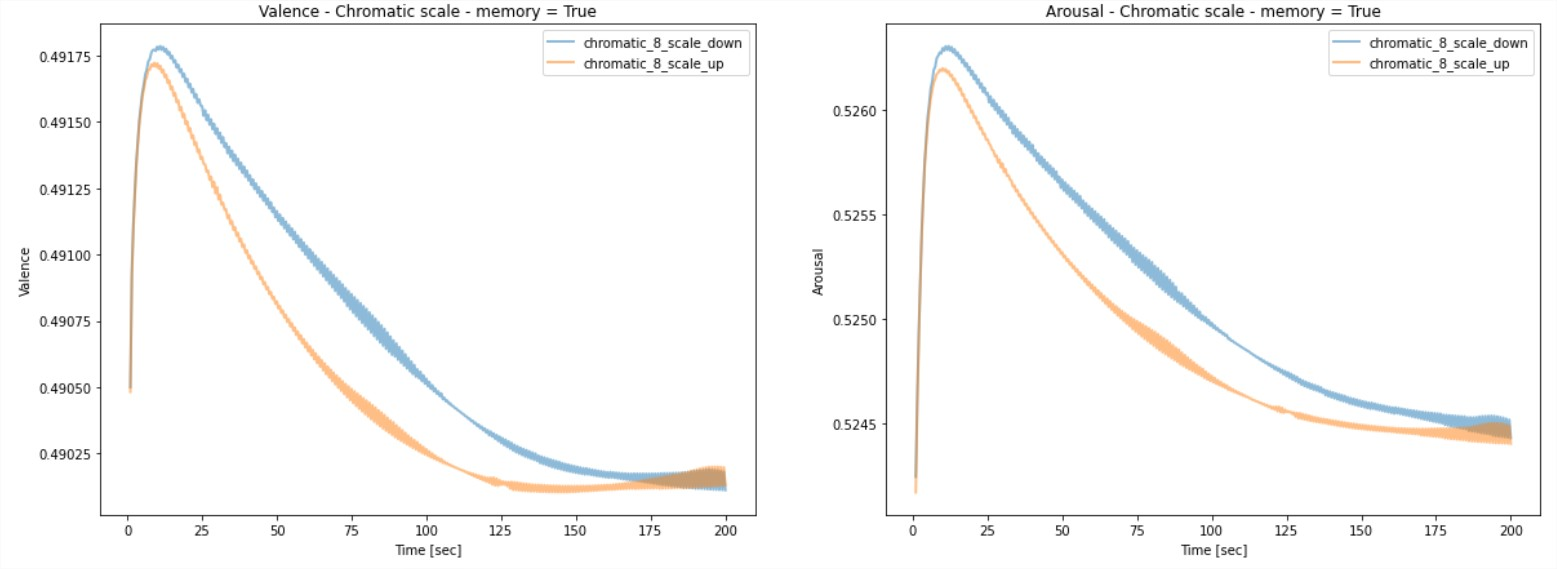
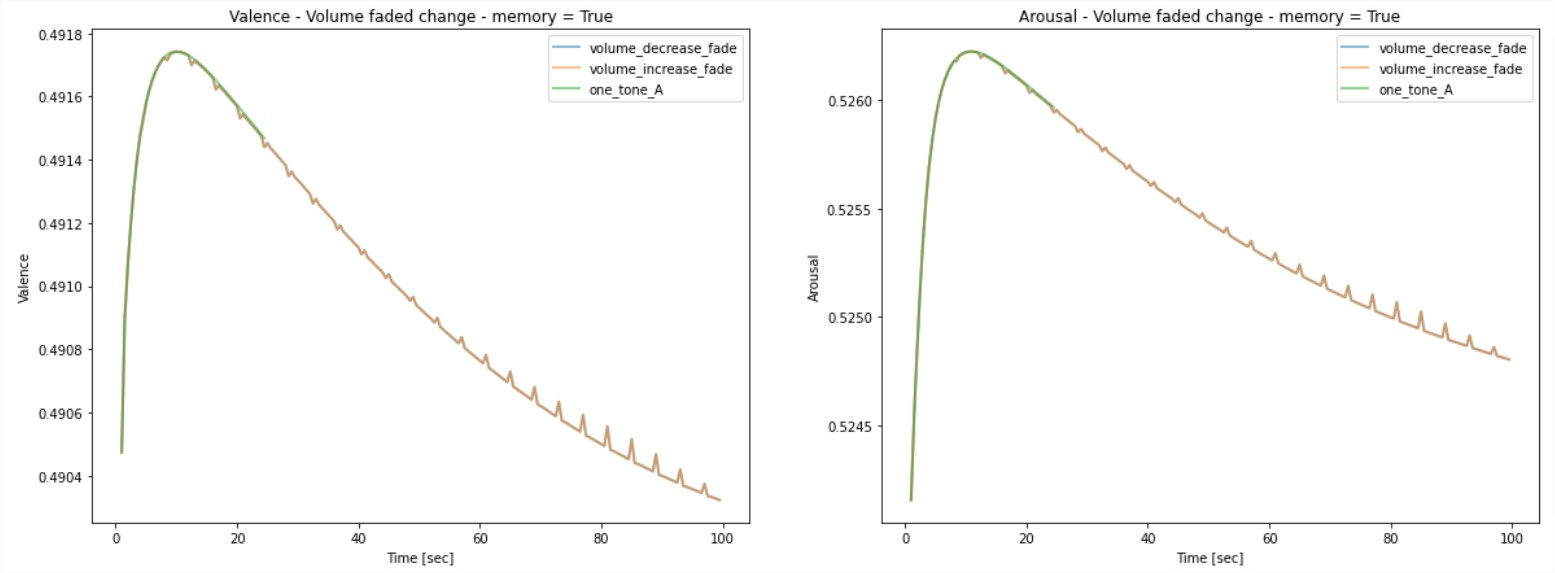
- Pitch variation - while tempo and volume change had minor to no effect on the emotional prediction, chromatic scales showed clear change in the prediction, meaning that melodic pitch variation is a leading factor.
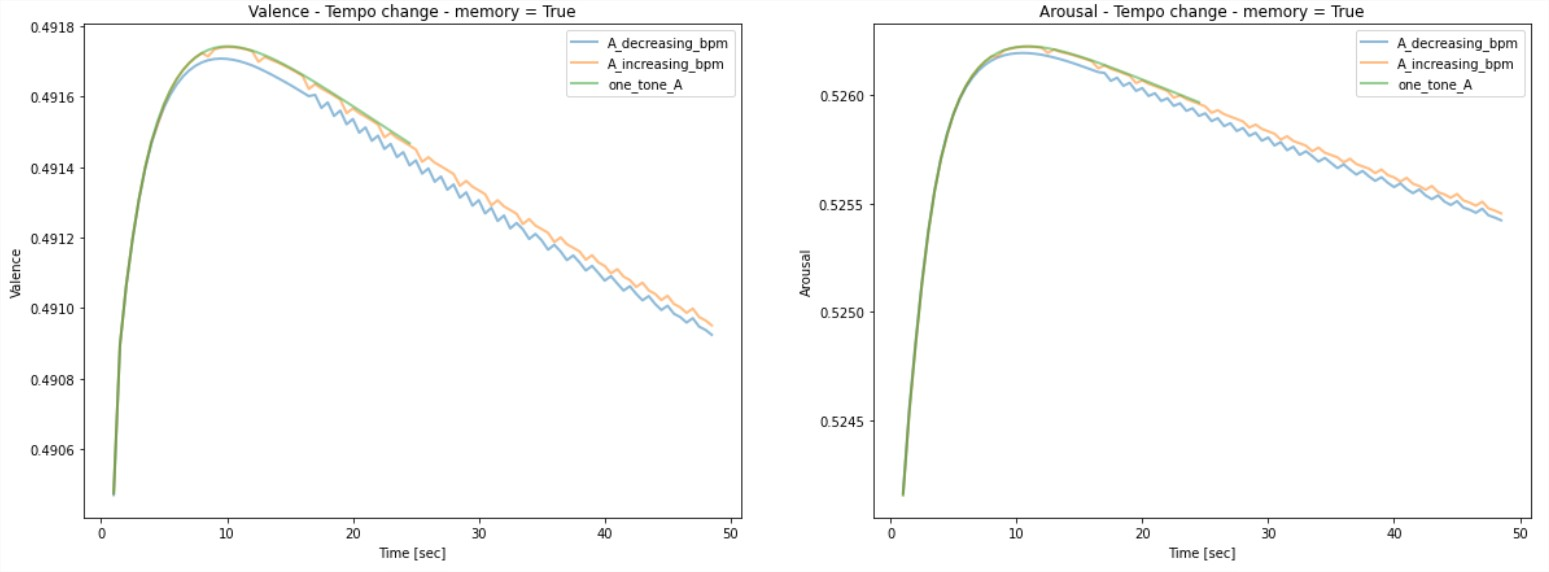
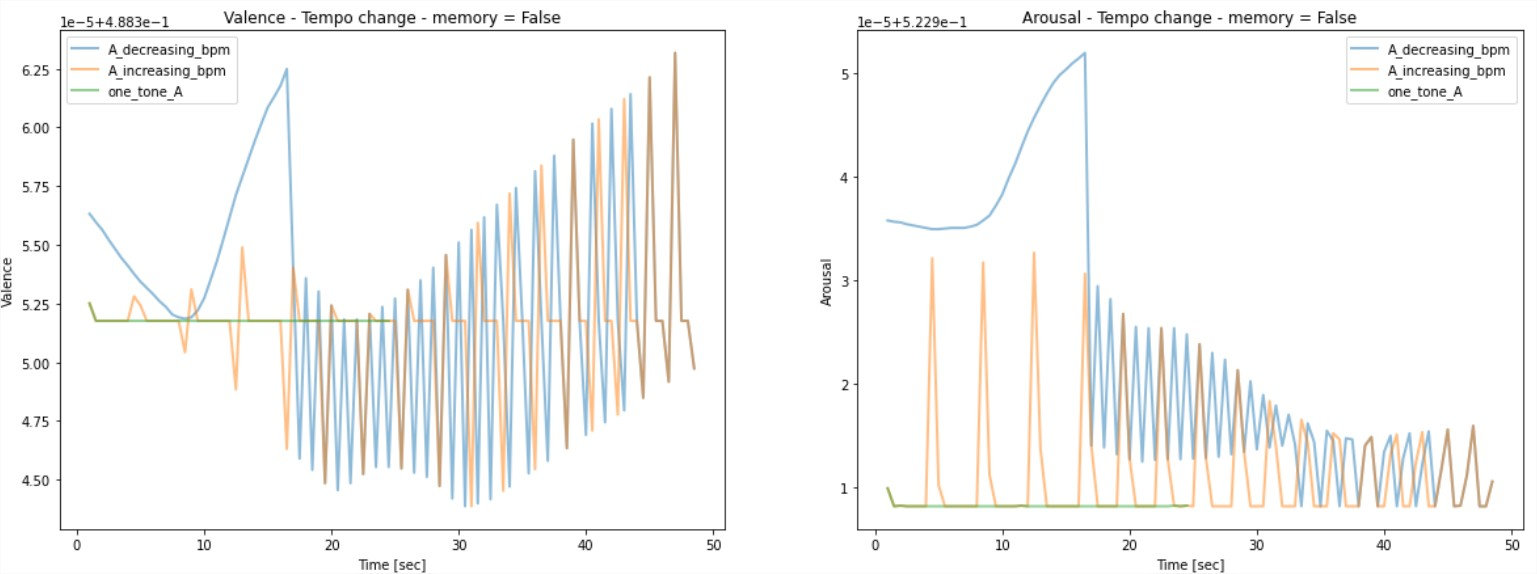
- Tempo - when analyzing predictions without short term memory, we see that tempo is an important factor.
I also demonstrated possible adaptations or implications to the research, such as powerful research tools, and an emotional expression practice tool for musicians.
To me, the most interesting conclusion was how absolutely we depend on our “trainset” in our experience of emotions in music. While genetics and natural inclinations may dictate the architecture of our brain (our neural network); our human brain, just like the neural network, does its learning from experience and correction. We hear countless musical phrases throughout our lives, and are “trained” (by cues from lyrics, society, corresponding art etc.) to interpret them in a certain way. With enough musical experience, we create deep subconscious connections between complicated factors and patterns, and emotional experiences.
We are each unique in our experience, because our brains were “trained” differently!
That’s what gives us the unique, indescribable, unequivocal human experience.
