Note on the limitations of the graph
Since I wanted to show the graph of mind wandering of my audience while the memory of their experience was still fresh, I prepared the questionnaires and the base for the graph in advance. In this way, I could draw the resulting graph much faster and show it to the audience at the end of the same session. This, however, created some inaccuracies in the resulting graph:
Inaccuracy 1
As I did not want to look constantly in the prepared script, I ended up saying some sentences in a slightly different way than how they were formulated in the questionnaires (Fig. 1).
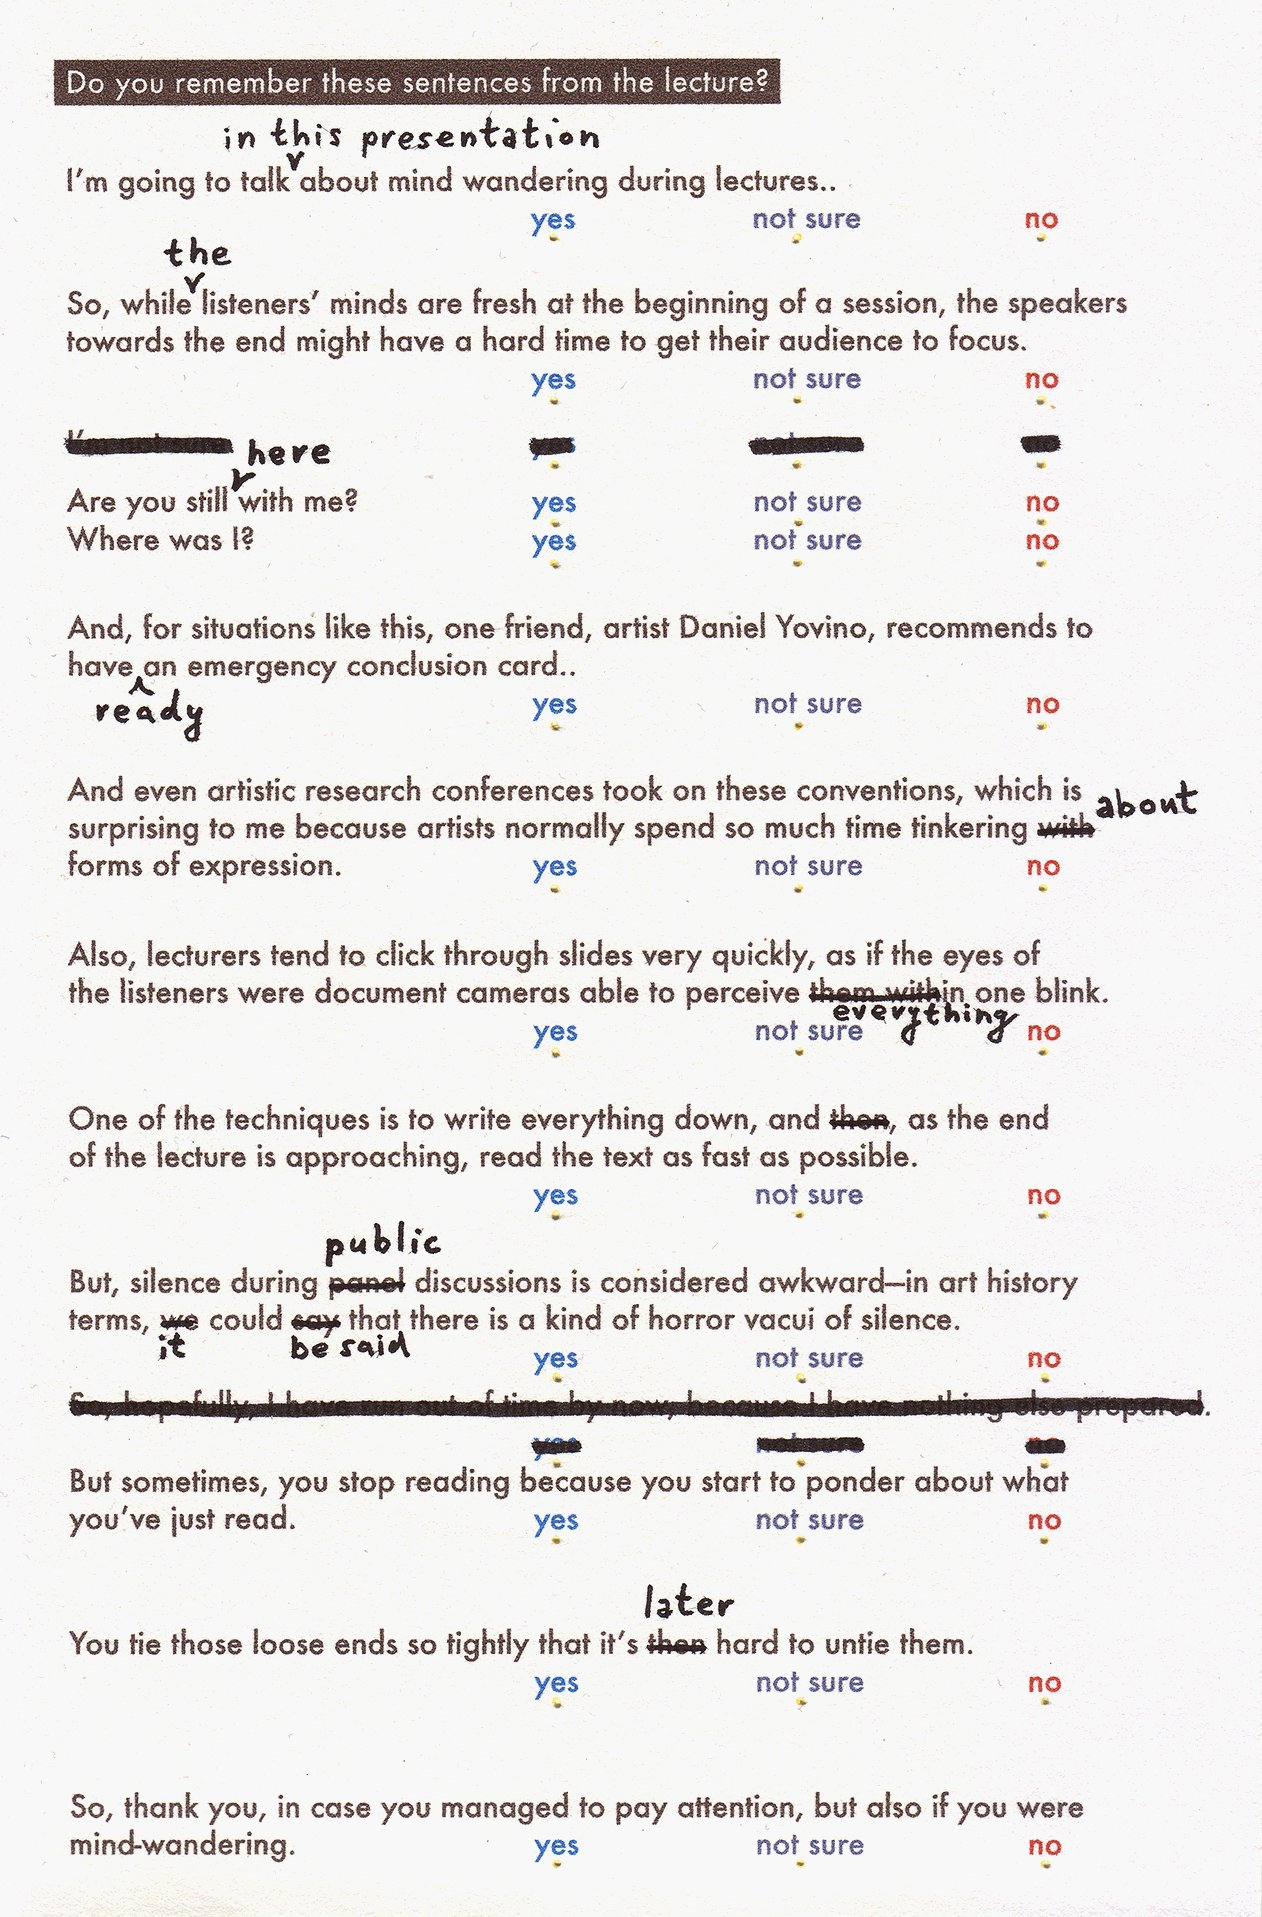
While I was giving the questionnaires out, I told the audience that, if the listed sentences differed in a couple of words from what I had said, they still counted as the sentences I had said. Nevertheless, these differences might have made it harder to recall what had been said and to decide which answers to choose.
Inaccuracy 2
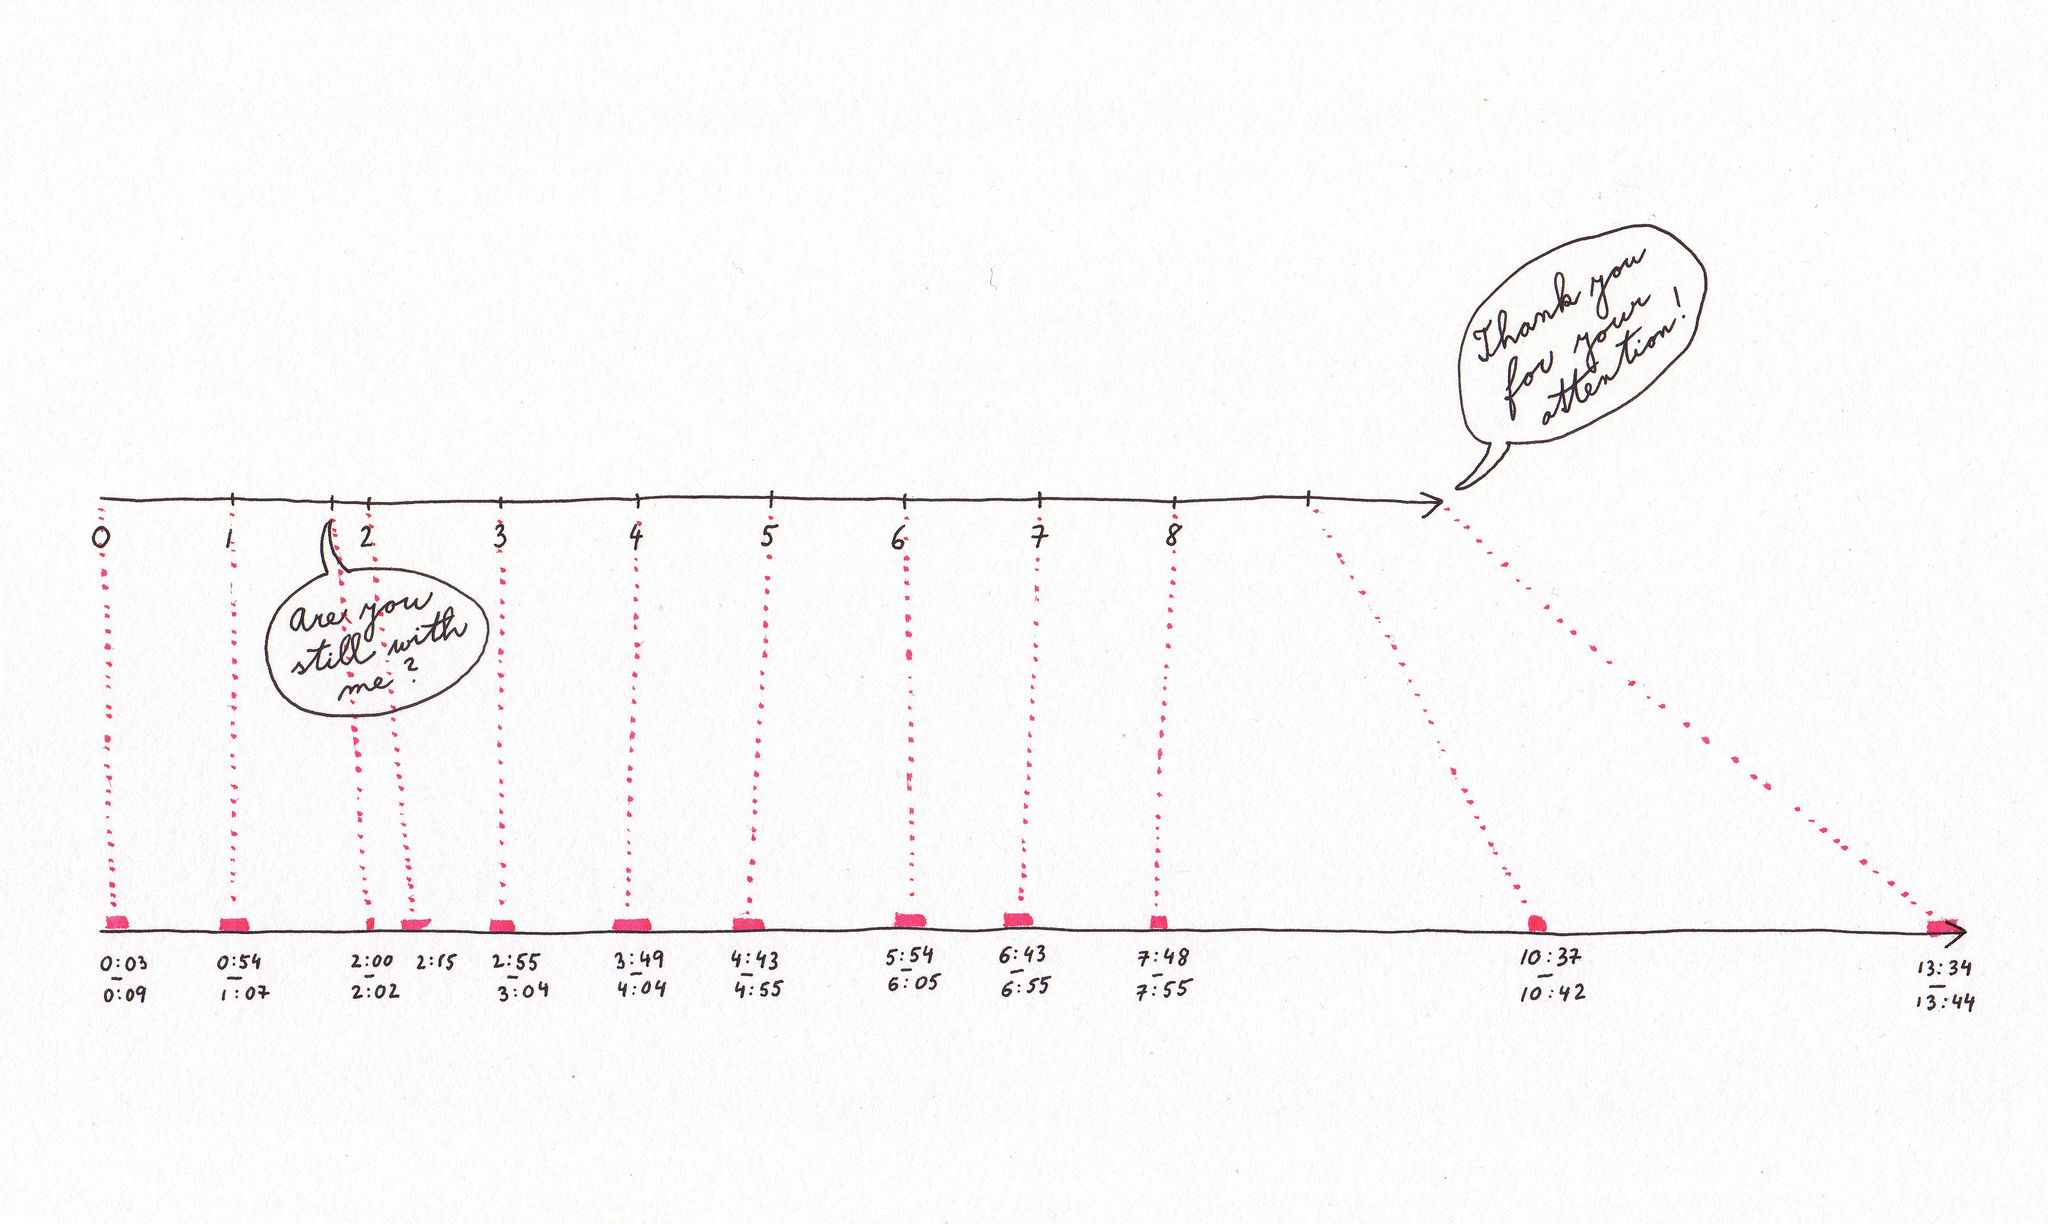
The base for the graph was also prepared in advance, so the actual times of when which sentence was said also slightly differed from where they are plotted on the graph (Fig. 2).
Confusion with the first control question
The choice of the first control question—“I’m not sure” (the third question, crossed out, in Fig. 1)—might have created confusion, since “not sure” was both in the sentence and in the answer choices. In fact, from the participants who answered to the control questions with one “no” and one “not sure”, all but one were “not sure” about the “I’m not sure” sentence.