4. Methods
4.1 Data Collection Method
A group of residents living within the geographical limits of the QDS was asked to fill in an electronic diary of their experiences throughout the 2019 festival season (May to September 2019) at least once per week or whenever they had a particularly positive or negative experience. A list of questions guided participants to provide details on the festival or event triggering the situation, its effects on their everyday life, and how they handled it. Each participant filling in the digital diary was assigned a unique diary ID to use rather than their names, reducing identifying information. The digital diaries were hosted on a secure university server,[4] with collected data accessible only to the research team. Diary completion was monitored by the data collection team, and gentle reminders were sent by email if a participant failed to fill in their diaries for more than a week.
The diary completion was accompanied by compensated face-to-face interviews with diary participants, completed at the beginning of the data collection period and, if desired by the participant, at the end as well. The interview had two parts: (1) describing the project and how to fill in the diary and (2) a semi-structured interview on the 2019 festival season experience and on living in the QDS in general. The interviews aimed to document participants’ perceptions of life in the QDS, both as residents and as festivalgoers, how the neighborhood and the festivals had changed throughout the years, and who they felt both were for. We also conducted interviews with three participants who were not able to commit to the full diary study: two QDS residents and one person working in the neighborhood. These interviews were similar to the initial interview for the diary study.
4.1.1 Recruitment and Participants
The recruitment of diary participants was achieved in multiple stages: we first presented the diary study at a biannual neighborhood committee meeting and then posted the call for participants on the official Sounds in the City website (in English and French), in the QDS newsletters, and in the mailing lists of other organizations and companies active in the area. While we did not formulate any exclusionary criteria for recruitment, we did not engage with residents in public housing due to, e.g., architectural and planning differences, governance structures, stricter ethical considerations, and aspects of housing choice. Additionally, the neighborhood has a sizeable number of people experiencing homelessness, of which many are First Nations, and at the time of this study we felt that our relationships with these groups were inadequate for ethically inquiring into their experiences.
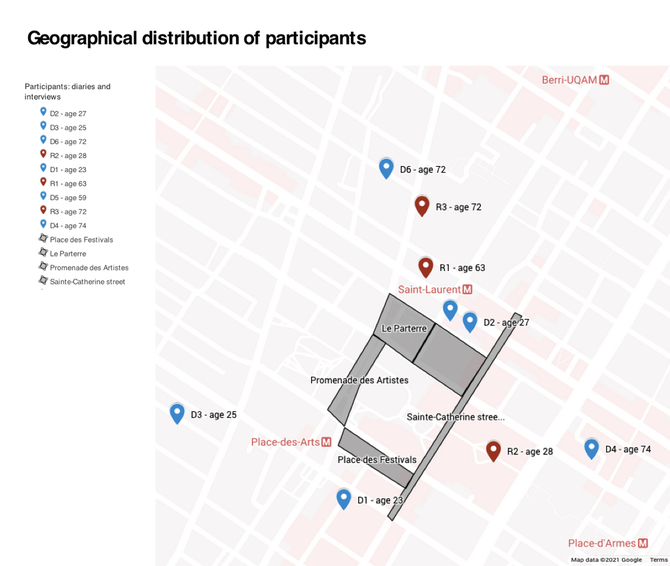
We collected data from nine residents and workers (hereafter referred to as “locals”). Six participants (anonymized D1 to D6) fully completed the diary and the initial interview (mean age: 41.2, median: 27; three women and three men); D1 was also interviewed at the end of the study, resulting in a total of 7 interviews. We collected 43 diary entries, spanning over almost three months. We conducted additional interviews with three participants (two women and one man): two residents (aged 63 and 72), and one person working in the neighborhood (aged 28), anonymized as R1 to R3. A rough geographic distribution of participants and their ages are represented in the map below, using their 6-digit postal code. Answers are identified in Figure 2 and in text using the participant’s code (D for diary, R for interview) along with the age of the participant.
4.2 Data Analysis Method
All recorded data was transcribed; incidents were coded into large tables and subjected to a multi-step analysis, structured inductively around themes emerging from the analysis and, afterwards, refined deductively with the help of concepts and ideas from the reviewed literature (see Table 1). Using the constant comparison method, we identified a number of recurrent topics related to participants’ experiences in a festival neighborhood (Corbin and Strauss 2014) and grouped them under broader themes. We first categorized the transcribed corpus as part of an open coding process, followed by axial coding to identify the main relationships between the key topics brought up by participants. While many topics included explicit mentions of sound and noise (in particular the sound of festivals), a number of contextual, non-sound-related topics (like convenience, accessibility, or the existence of services) were included in the development of broader themes.
The emerging topics and themes were refined using the work of Bélanger and Cameron (2016) to explore how participants navigated their different ways of using the neighborhood, as locals or as festivalgoers,[5] and to determine whether those experiences became intertwined or if they remained situated at the opposite ends of a continuum. To this end, we explored in depth the notion of sound as challenging spatiality and the physical boundaries between home and the neighborhood, informed by literature on the fluidity of the geographical boundaries of home (Mallett 2004; Bélanger 2012) and on the porosity of private and public spaces from a sonic perspective (Féraud 2010).
As concerns spatial considerations, we analyzed residents’ experiences in their private space and in the public (festival) space. To research their experiences as locals and festivalgoers in the public (festival) space, we added a sonic layer to Stevens and Shin’s model on the social space created by festivals, documenting participants’ spatial relationships with the neighborhood. An emphasis on festival-related spatial arrangements, as relevant for behavior and social interaction, translated into understanding how the presence of festivals brought about changes, advantages or challenges to their experiences, e.g., their freedom of movement or accessibility. Furthermore, inspired by the idea of festivals as third places, we touched upon aspects of comfort and safety in the neighborhood during festivals.