What happens to our understanding of an urban landscape when 3D images and 3D sound are combined and experienced off-site?
To explore this idea, we first needed to determine the most effective method for capturing our 3D materials.
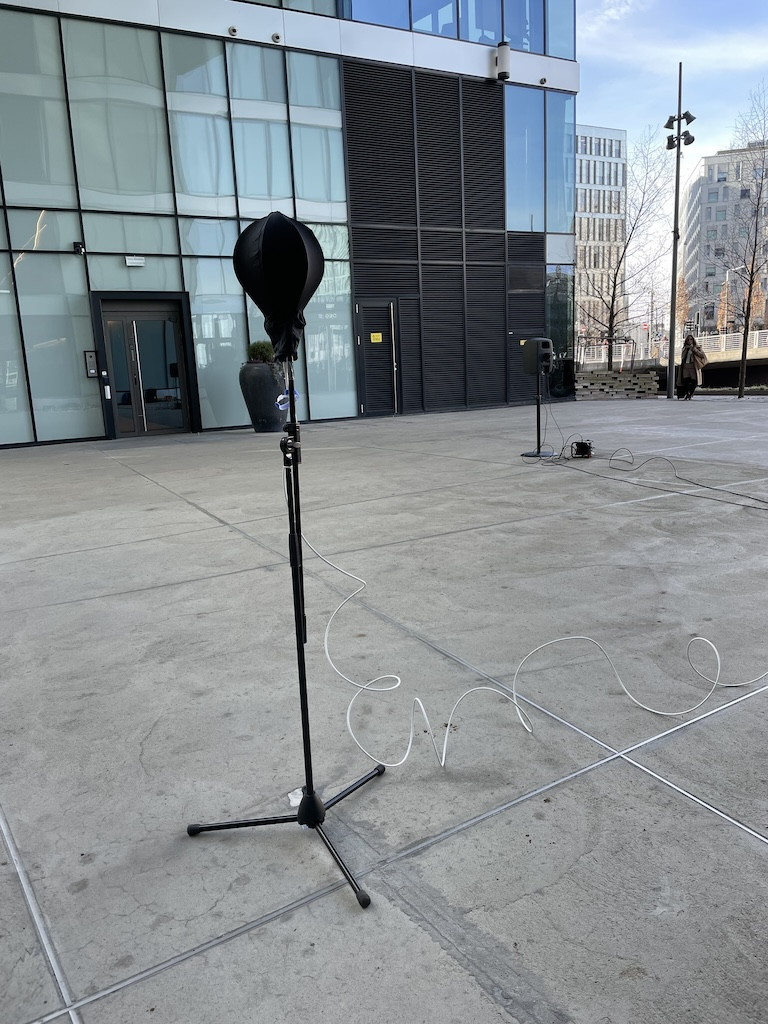
In earlier modules of the Reconfiguring the Landscape Project (for example Subliminal Throwback and PRESENCE | NÆRVÆR), Natasha had developed a working method for capturing the 3D sound space. This most recent version of the method entails a two-part process: (a) capturing the soundscape over extended periods with the MhAcoustics EM32 microphone and (b) collecting impulse responses (IRs) using the same microphone strategically placed in static locations (IRs were recorded using a Genelec 8050 loudspeaker, an MhAcoustics EM32 microphone, and the Spat Sweep Measurement Kit). The method records a comprehensive, multi-angled auditory panorama and is a suitable approach for the Barcode project.
To record visual information, a 3D camera (Insta360) had been employed in earlier research for basic visual documentation. However, our current objective required capturing high-resolution 3D geometry. LiDAR scanning was a logical choice; similar to audio IRs, the LiDAR scans freeze a moment in time, and the data visualised and can later be navigated with 6DoF.
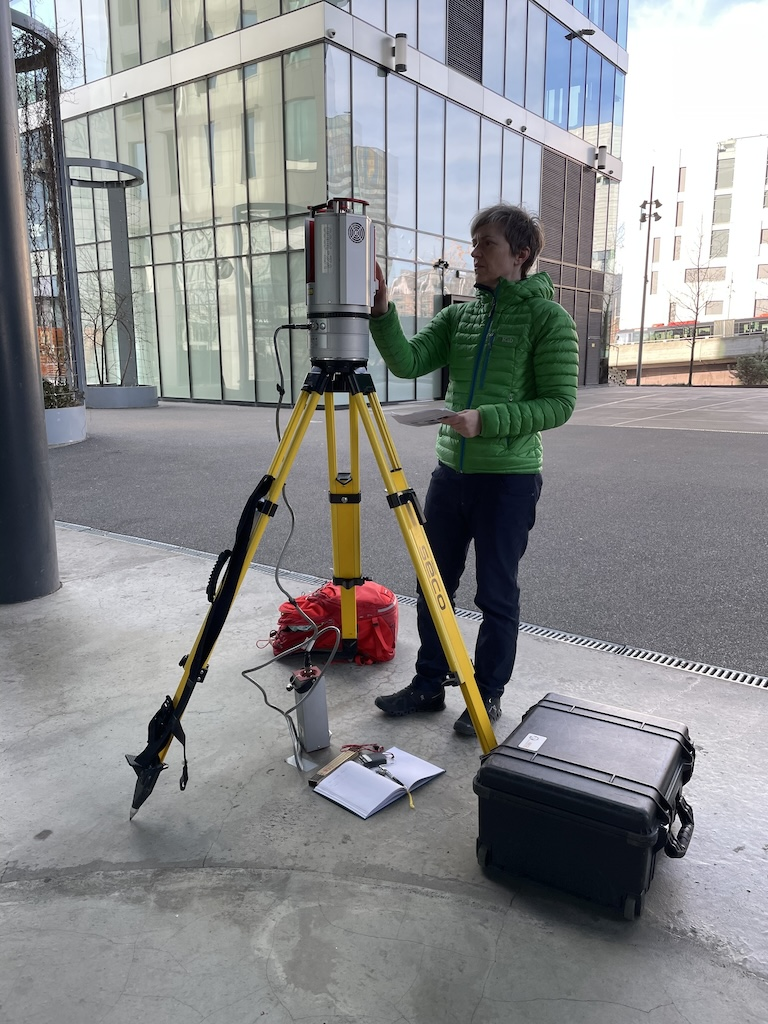
In collaboration with project member Professor Karen Mair and the Department of Geosciences at the University of Oslo, we acquired a high-resolution LiDAR scanner (Riegl VZ-1000 3D Terrestrial Laser Scanner) with a range of 1400 meters, providing up to 5 mm accuracy and 122,000 measurements per second. During the start-up phase of the Reconfiguring the Landscape project in 2019, Karen received instruction on how to use the equipment. Natasha and Karen then conducted some test scans around Majortuen and Blindern. Although these tests remained unused due to COVID canceling further work, Natasha explored the possibilities of the data. In the Barcode project, she resumed developing a data interaction method from where she left off in 2020.
The requirements for the location were that it should be outdoors, inner city, with interesting acoustics and where we could obtain permission to record and access 230V electricity.
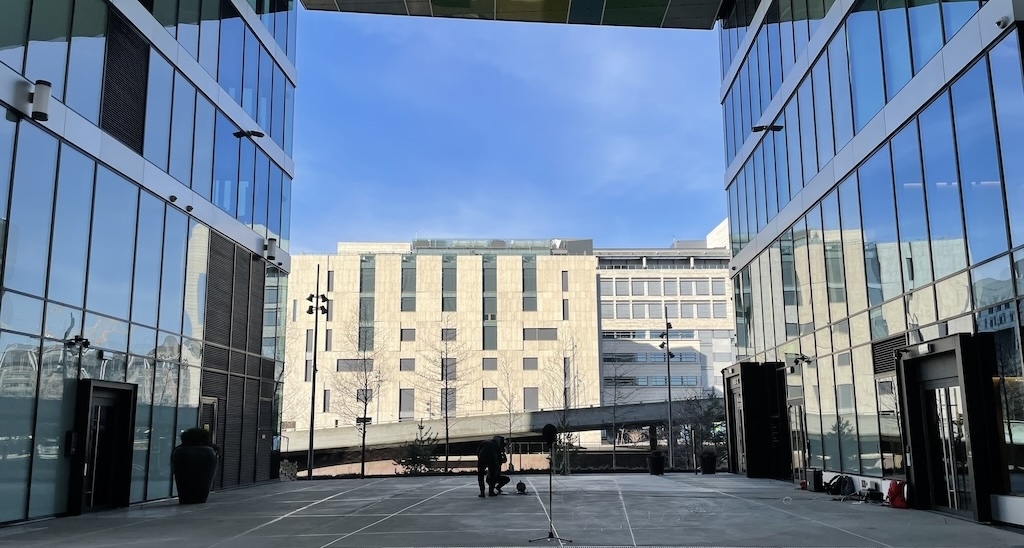
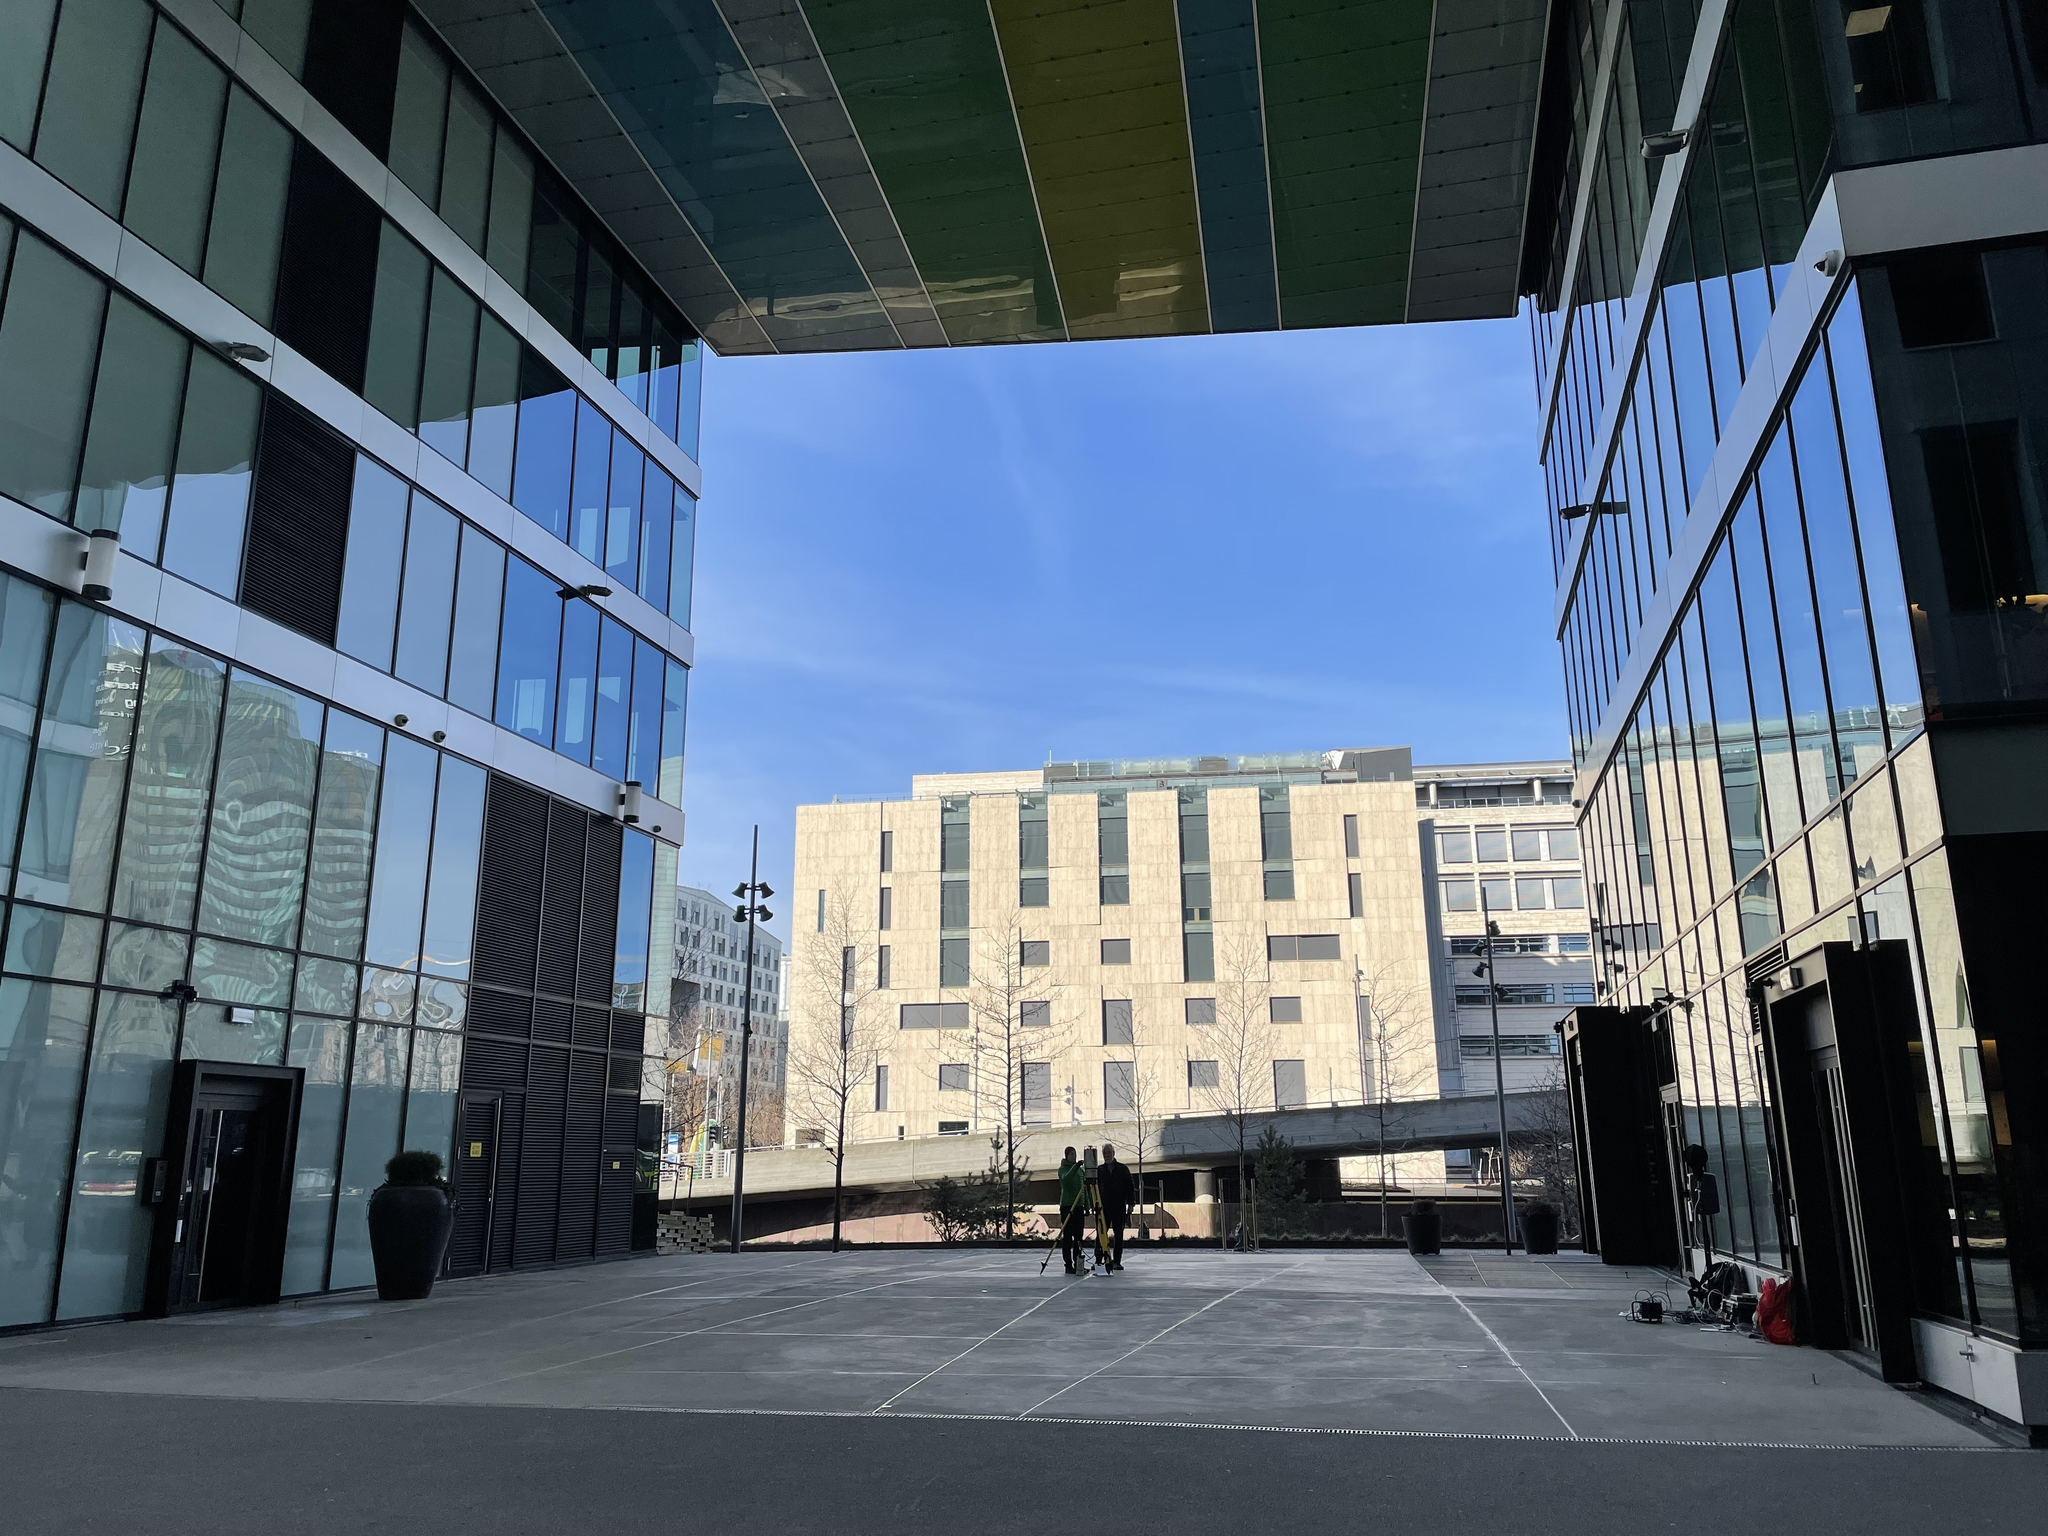
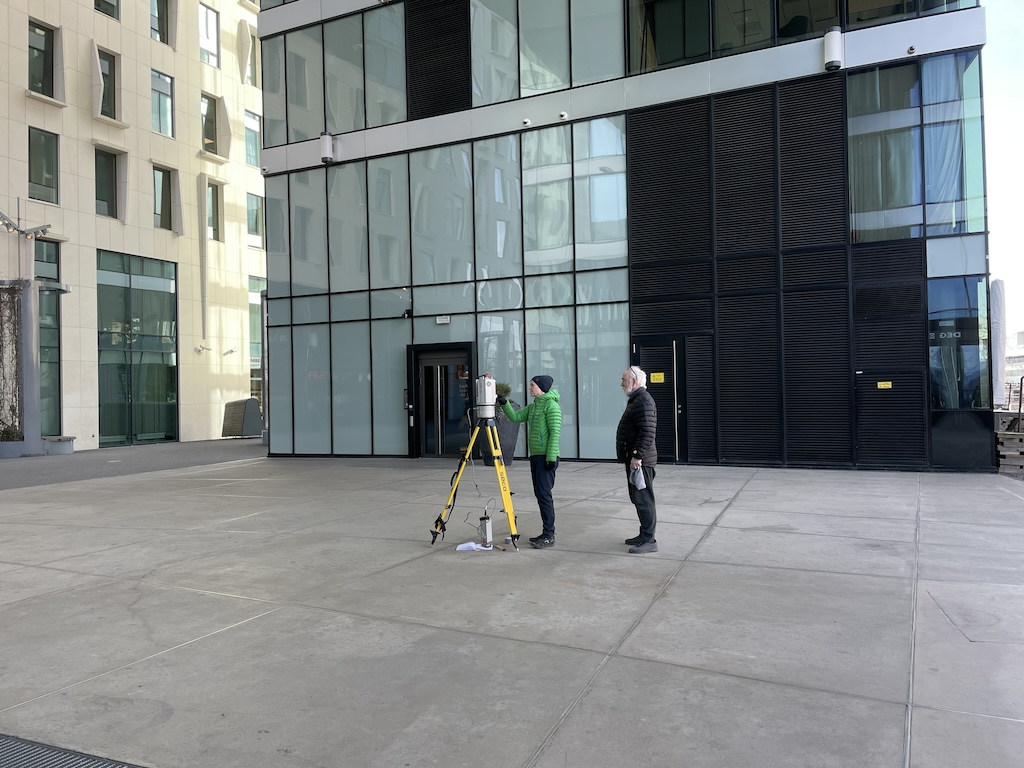
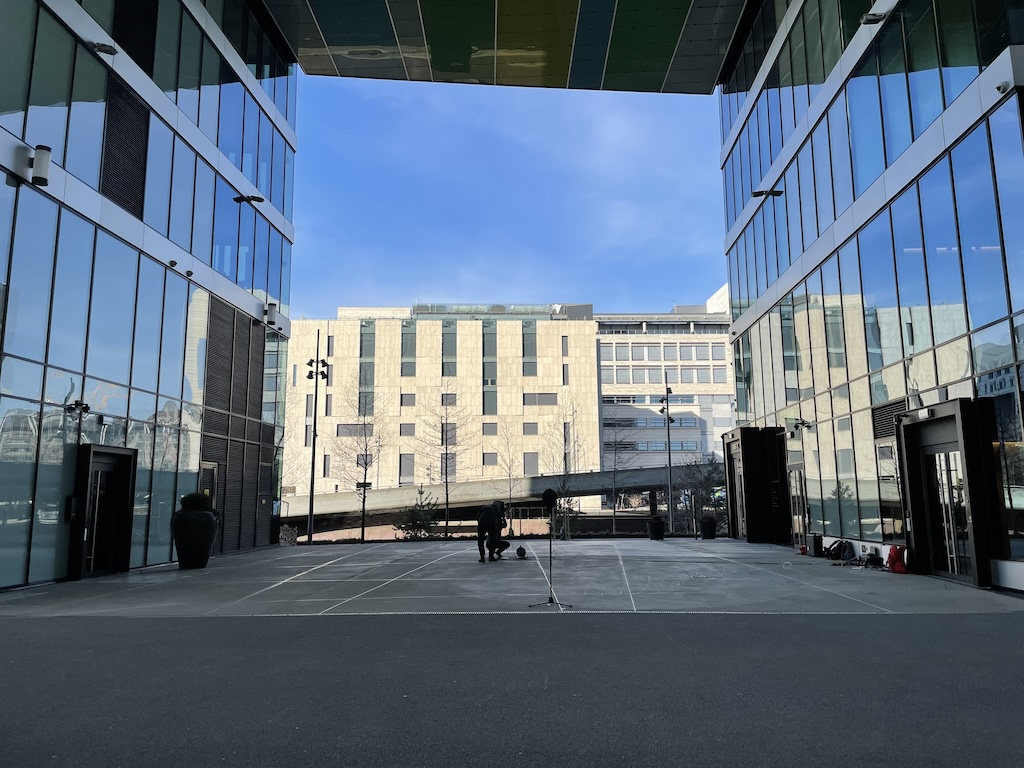
Dronning Eufemias gate 8, located in the Barcode district of Oslo, was an appropriate site. Leading through the building is a large, square arch. The walls and ceiling are glass. One side opens out onto a small pedestrian road and then more glass walls, while the other side opens out onto the canal. Adjacent to the building are main roads through Oslo, and a short distance away is the Oslo Central Station.
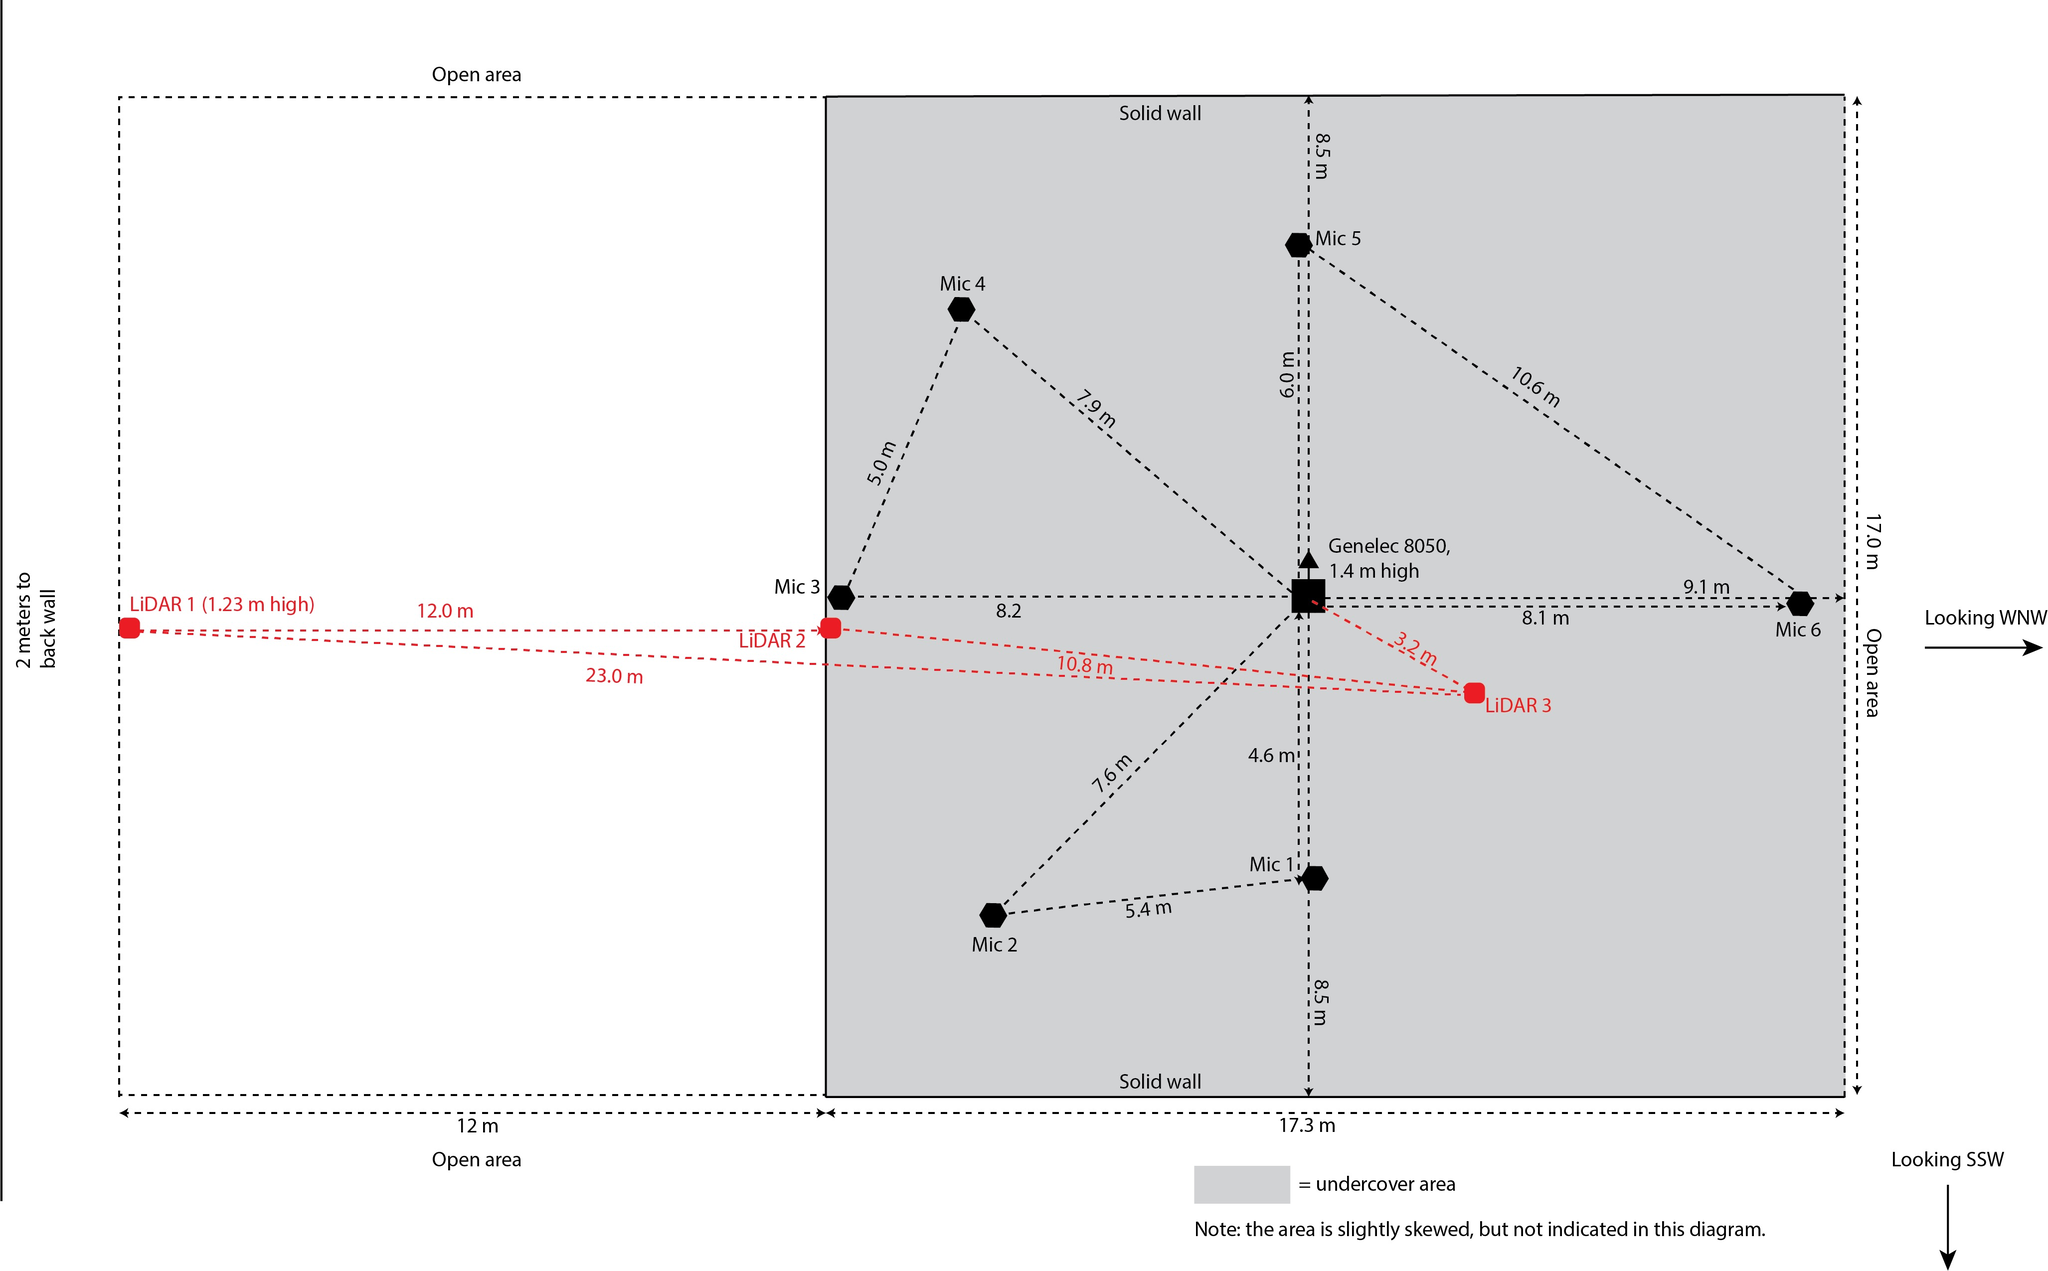
The LiDAR and EM32 recordings were made on the 13th March 2022. The locations of LiDAR, EM32 microphone and loudspeaker are shown in figure below. The grey area is the undercover area of the square arch. LiDAR scans were made in three locations (shown in red), and IRs were made in 6 locations (shown in black).
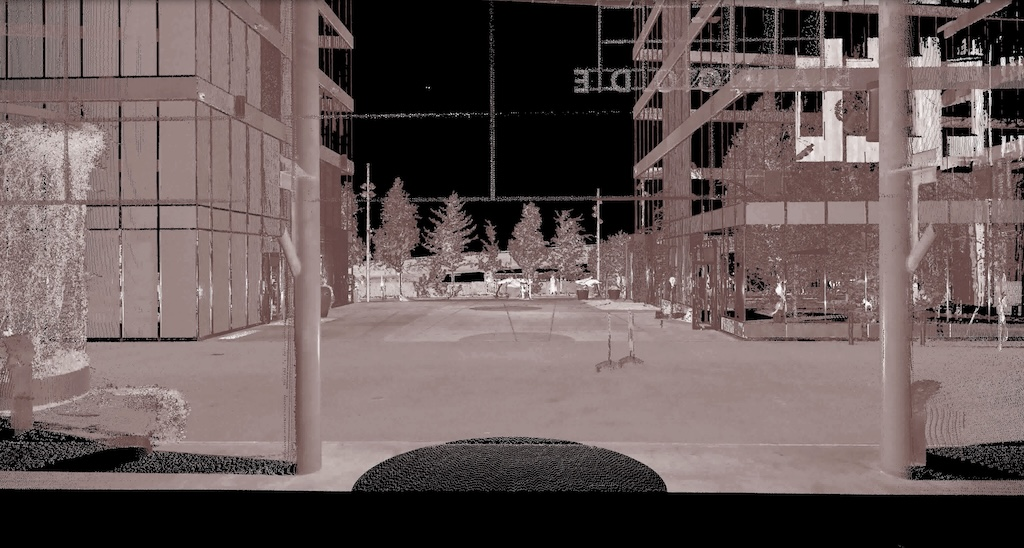
LiDAR data was rendered as a dense point cloud that could be viewed in the free Cloud Compare software. The next step turned out to be more challenging than expected due to the magnitude of data exceeding our private computing capabilities. As a result, we had to process the data using resources at the University of Oslo. There are various ways to do this, such as simplifying the data through decimation or selective filtering based on factors like material reflectivity.
To narrow down our focus, we decided to explore potential exhibition locations for an artwork in the Barcode district. The choice of venue would in turn suggest a framework for the mediation method which would then guide how we pre-process the data. For example, if we were to exhibit in a spacious setting with a 4K projector and a 3D loudspeaker array, we might choose to pre-render virtual paths through the visual and sound information, as real-time interaction would be too demanding for the computer. On the other hand, if we were to build an interface for the audience to navigate through the visual and sound information, we would need to reduce the resolution for real-time rendering.
Unfortunately, the schedules of all galleries were delayed due to COVID, and Karen, who had access to fast computing at the University of Oslo, had relocated to Scotland by this time. Consequently, we had to put the work on hold, and other Reconfiguring the Landscape modules took priority.
In the closing months of the Reconfiguring the Landscape project in 2023, Natasha still wanted to test the original idea: what happens to our understanding of an urban landscape when 3D images and 3D sound are combined and experienced off-site? 2023 was earmarked for documentation only, and new exhibitions were not possible. Instead, Natasha decided that the best solution would be to render a series of short videos as case study examples which would also serve as documentation. Luc Girod, also at the Department of Geosciences but working through his private company (Luc Girod Photogrammetry Services), took over from where Karen had left off, and processed the data into a manageable size and rendered several viewpoint fly-throughs.
Natasha then returned to Dronning Eufemias gate 8 and made sound-walk recordings along the paths rendered as videos by Luc. This time she recorded with the new 3rd order Harpex spcmic, which is more portable than the EigenMike. The sound-walk recordings consisted of mundane traffic sounds, some doors opening and closing in adjacent builds, quiet footsteps and a few sounds from a distant building site. No passerby made any vocal sounds.
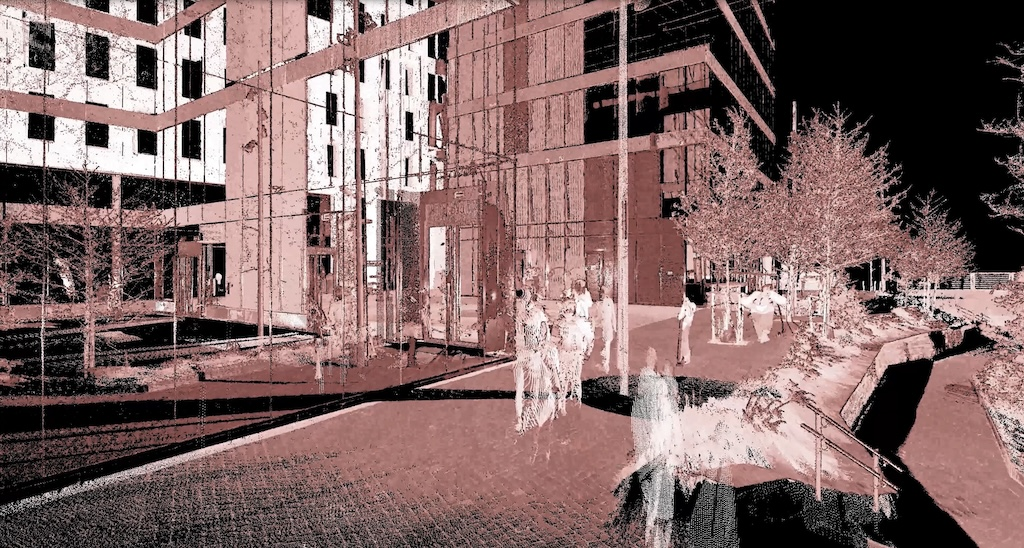
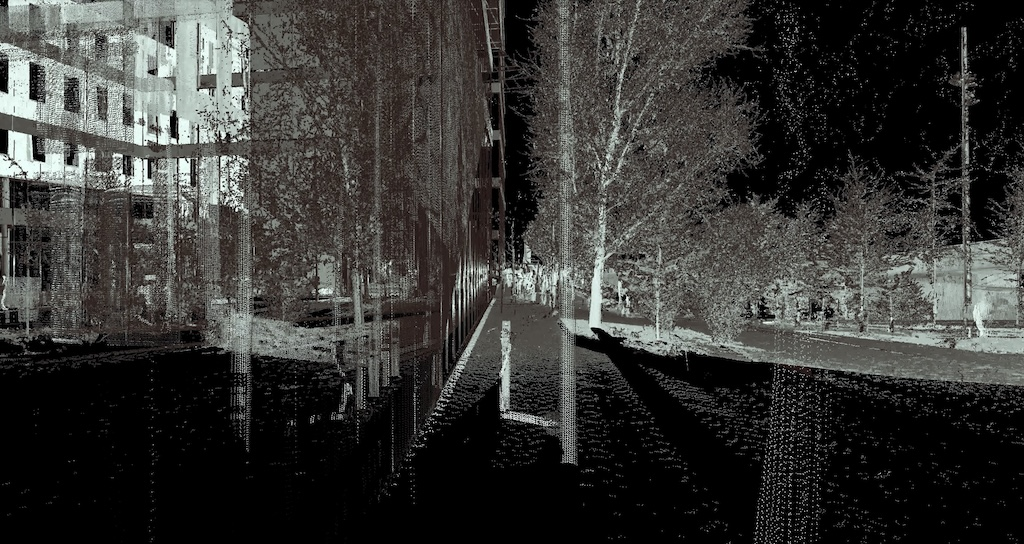
The Reconfiguring the Landscape project had now closed, and Natasha was no longer connected to the Norwegian Academy for Music. But she continued with the experiments. From several fly-throughs created by Luc, she selected three videos. The original videos were rendered in a red-white color scale corresponding to the surface density recorded by the LiDAR. Although we had the option to choose any color scale, Luc and Natasha concluded that this was the cleanest source for further work. The videos then underwent processing with various luma key settings to further enhance 3D visual details.
Natasha synchronised her soundwalk recordings with the moving viewpoints in the videos and rendered the result in binaural using the KU100 HRTF set. The only exception occurs at the end of video 2, where an intentional deviation takes place: an incorrect segment of the soundwalk is dubbed onto the video, featuring sound from under the bridge while the visual viewpoint moves away from the bridge. The objective here was to test whether listeners would perceive the difference.
The next stage involved incorporating the IRs to explicitly emphasise the spatial acoustics. A dry sound source (an excerpt of percussion recording from one of Natasha’s compositions from a different project) was convolved with the IRs to create the illusion that the sound source had been played at the site. Three specific IRs (IR3, 5, and 6 shown in the figure above) were chosen for this purpose, and proportionally mixed based on the viewing position in each video. This adjustment aimed to vividly highlight and exaggerate, in a hyperrealistic manner, the changes in acoustics as one passes close to or through the square arch.