The Plankton project interprets meteorological data from the Lake of Greifensee in a poetic, non-scientific way.

Each technical parameter becomes a gesture, a rhythm, a visual presence.

The goal is not to represent reality, but to listen to the data as if they were living organisms. Plankton is a symbol of fragility and adaptation, a body that responds to the invisible climate. Wind, temperature, rain, and pressure are transformed into signs, textures, and movements.

Each numerical value is accepted in its uniqueness, without averaging or abstraction. The composition changes like a sensitive ecosystem, in constant evolution. The interface allows you to travel through the years as landscapes of variation. The data becomes visual material, a perceptual experience, not information.


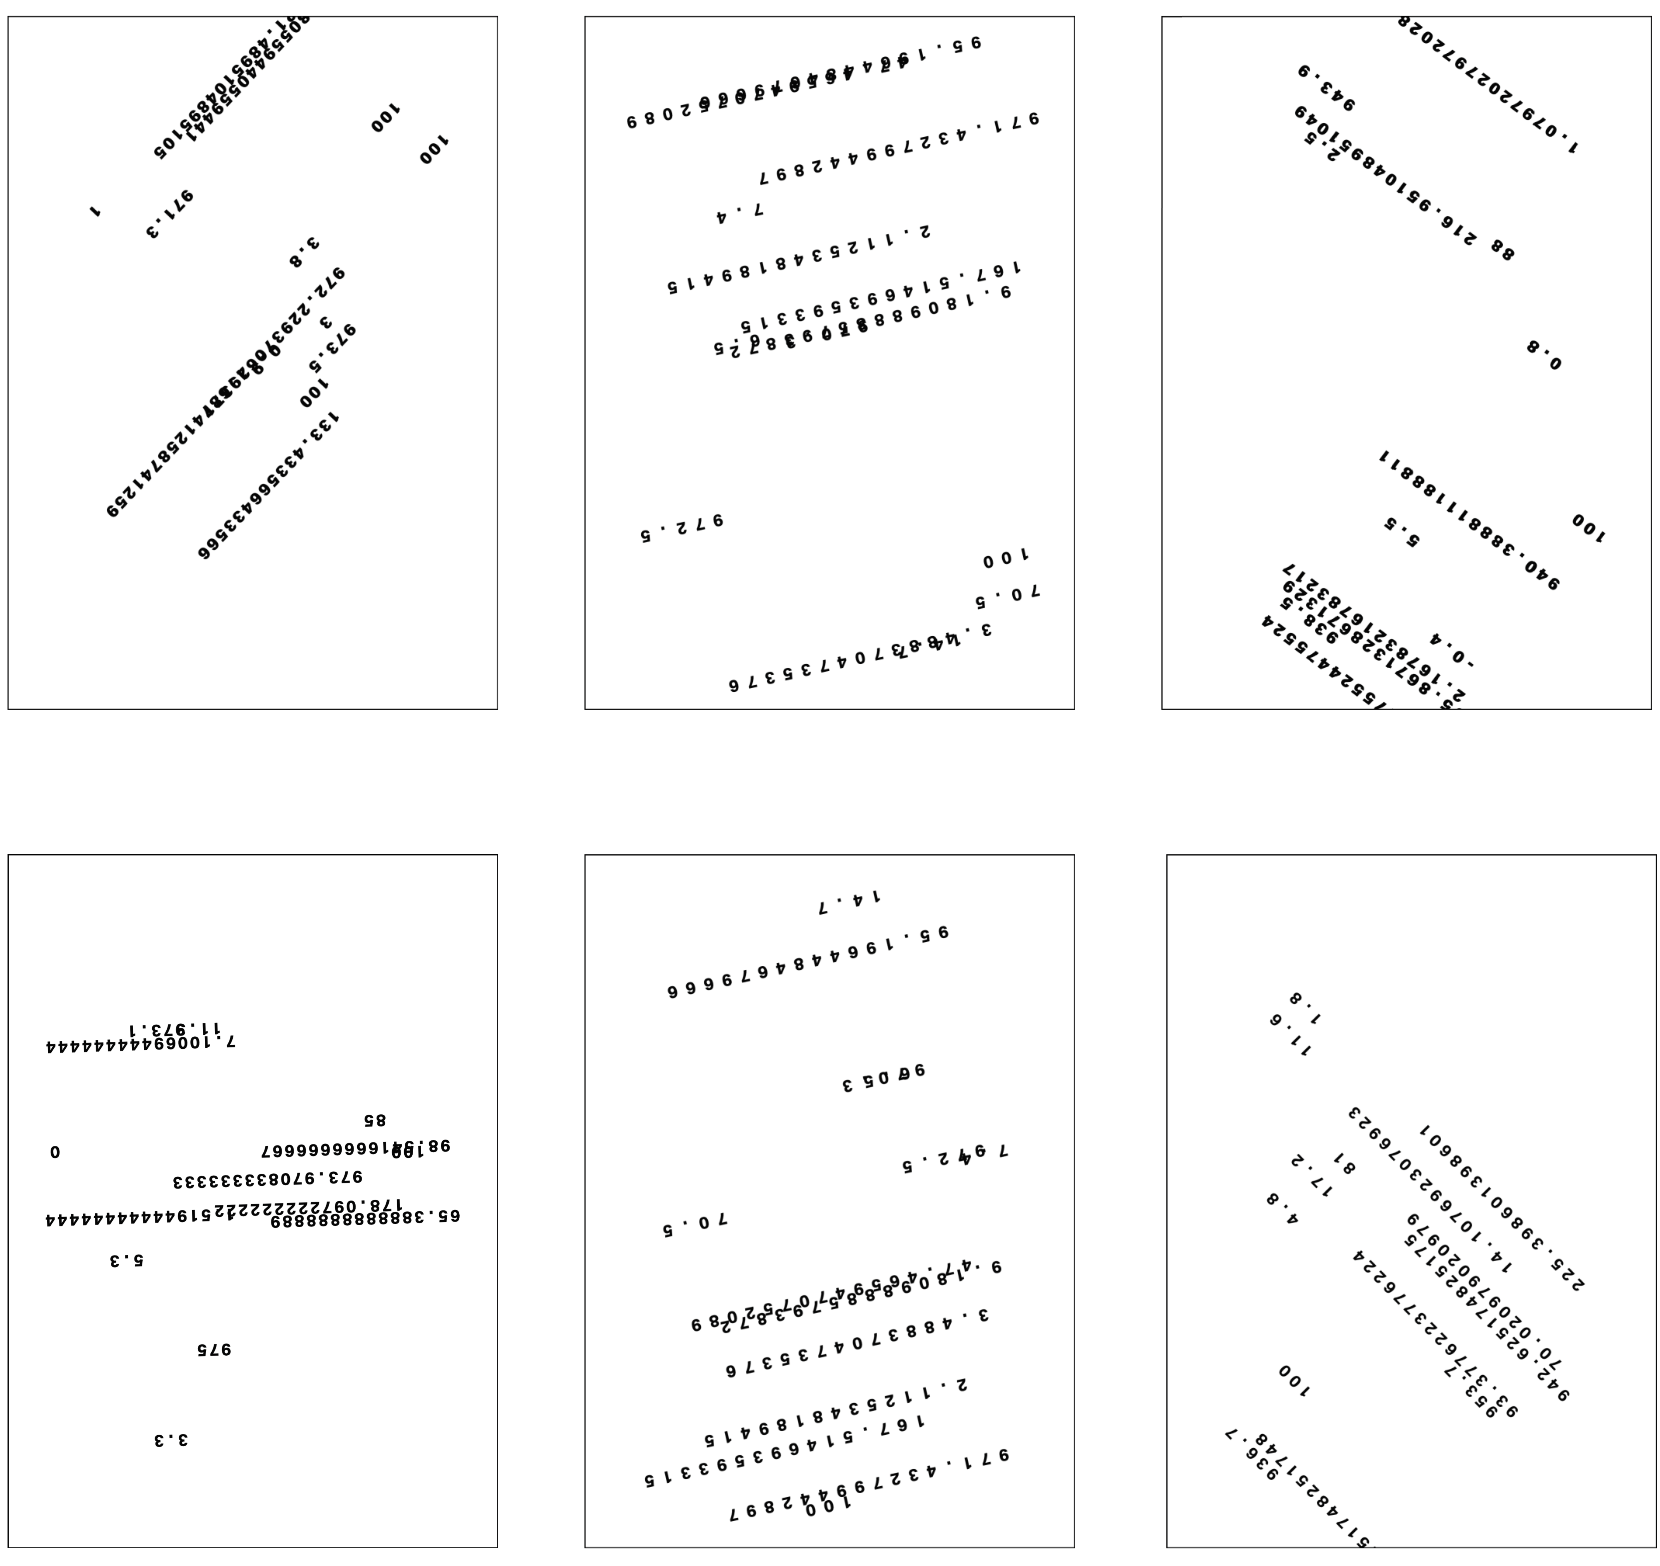
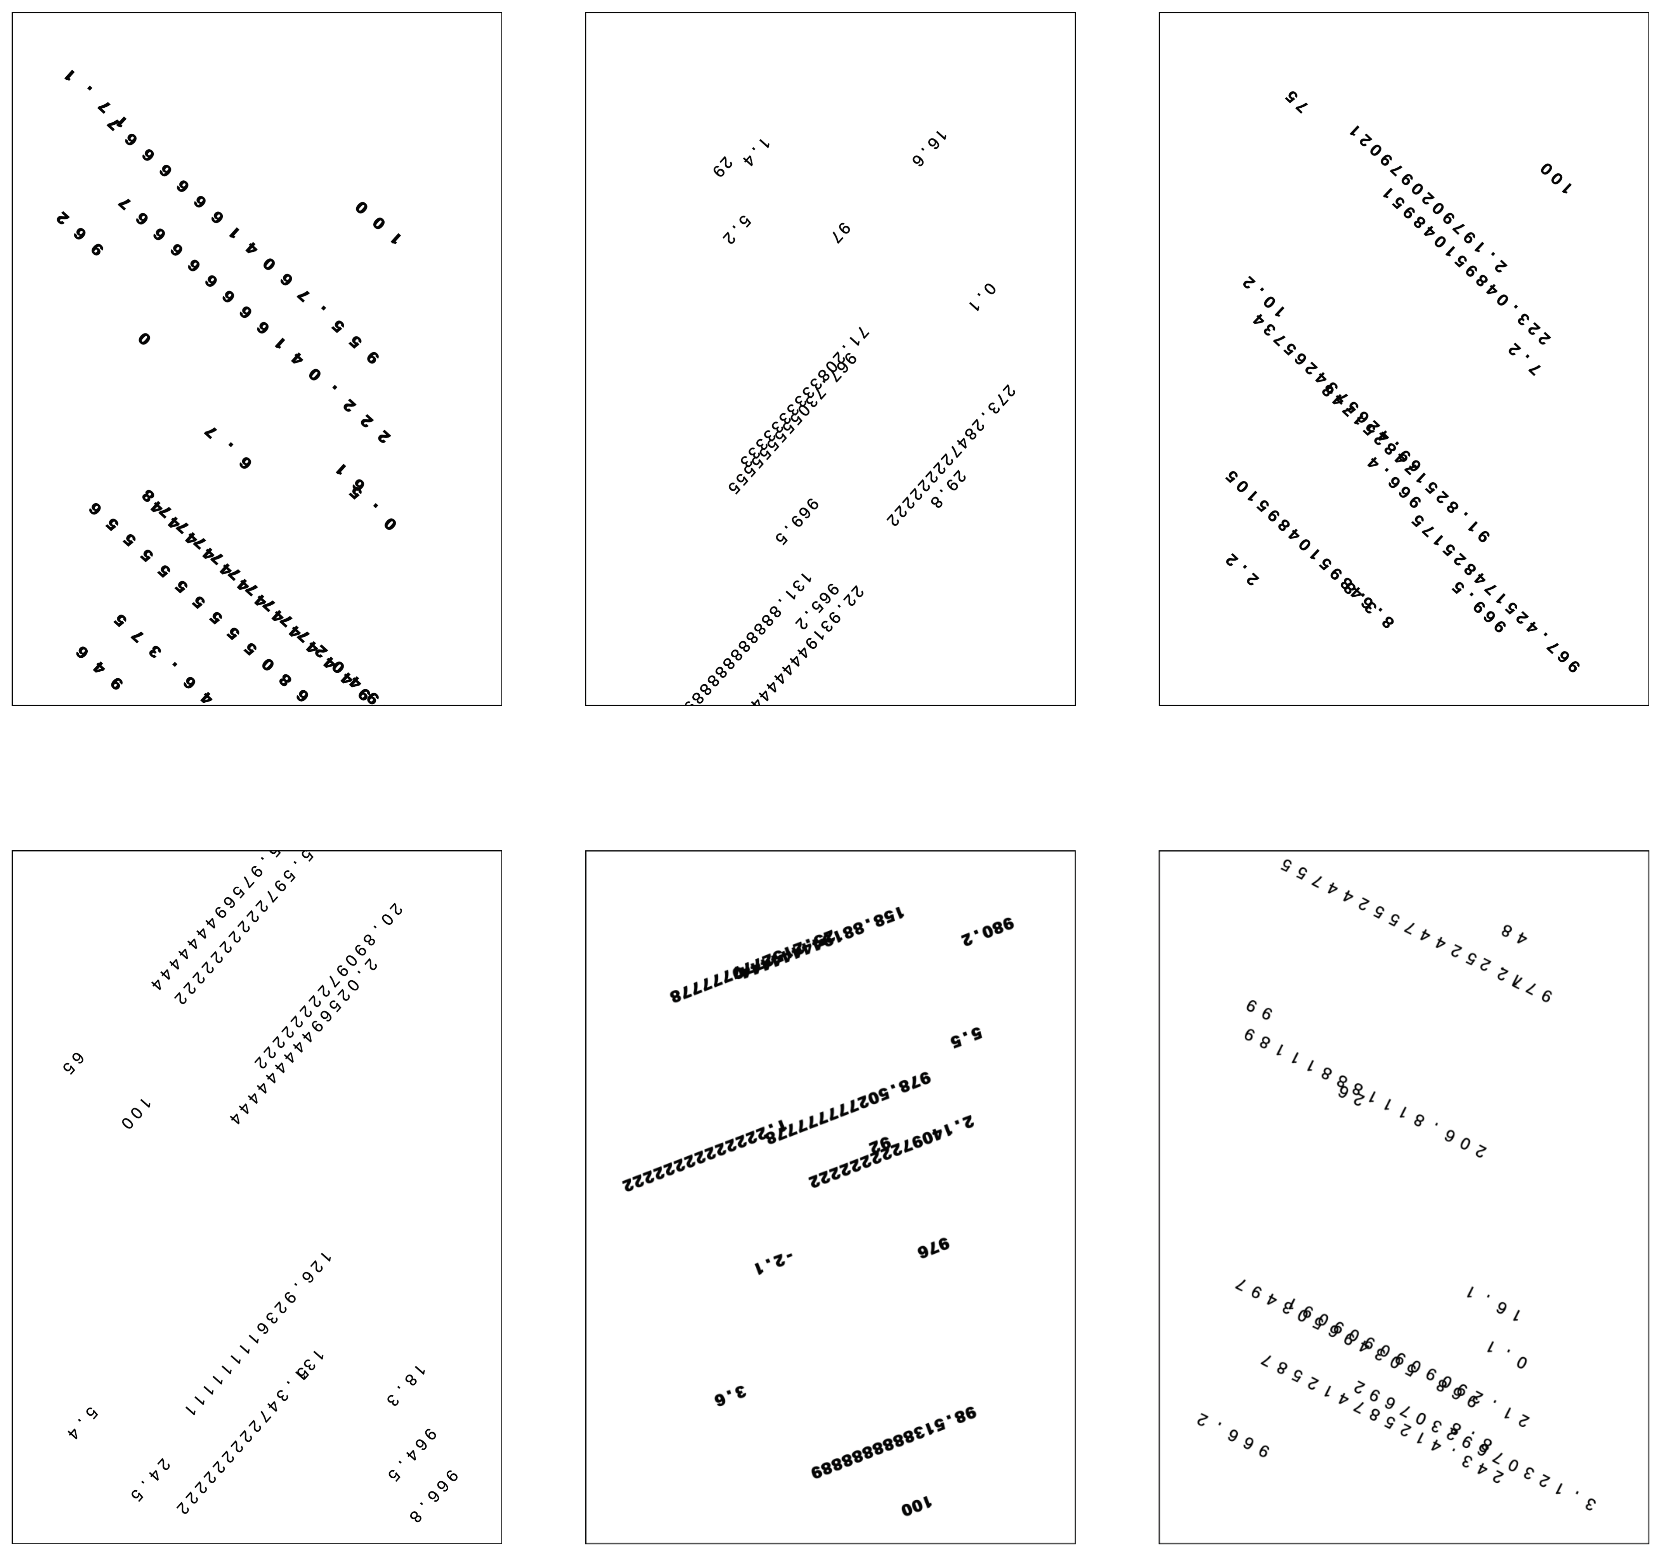
The system uses a JSON-formatted weather data archive that collects information such as temperature, wind speed and direction, humidity, and other atmospheric values for each day of 2020. When the user selects a date, the JavaScript code reads the file, locates the corresponding entry, and extracts the data. Each parameter is then translated into a visual element: the average temperature determines which font will be used, the wind direction determines the orientation of the numbers, and the wind speed modifies their spacing and rhythm. All values are drawn on an HTML5 canvas, where each digit finds a random position consistent with the weather conditions of the chosen day. In this way, each composition becomes a graphic trace of the climate, a typographic landscape in which scientific data is transformed into signs, movement, and form.

The work is built using web languages—HTML, CSS, and JavaScript—and reads climate data from a file called data.json. When the page is opened, the JavaScript code queries this file to obtain information for the selected day, such as temperature, wind speed, and wind direction, and transforms it into a visual composition generated in real time on the canvas. Each number, rotated and arranged according to the weather data, becomes a typographic trace of that day's climate.


Since the browser does not allow local files to be read for security reasons, the work must be launched through a small server called Live Server in order to function. This local server simulates a real website and allows the code to communicate correctly with the data.json file.


To activate it, simply open the project folder with an editor such as Visual Studio Code, install the Live Server extension, and open the index.html file with the “Open with Live Server” option. The browser will then display the work in operation, with the option to select dates and see the climate data transformed into typographic forms. Alternatively, the folder can be uploaded to an online platform, such as GitHub Pages or Netlify, where the installation will work automatically, ready to be explored by anyone.

Domenico Shadlou