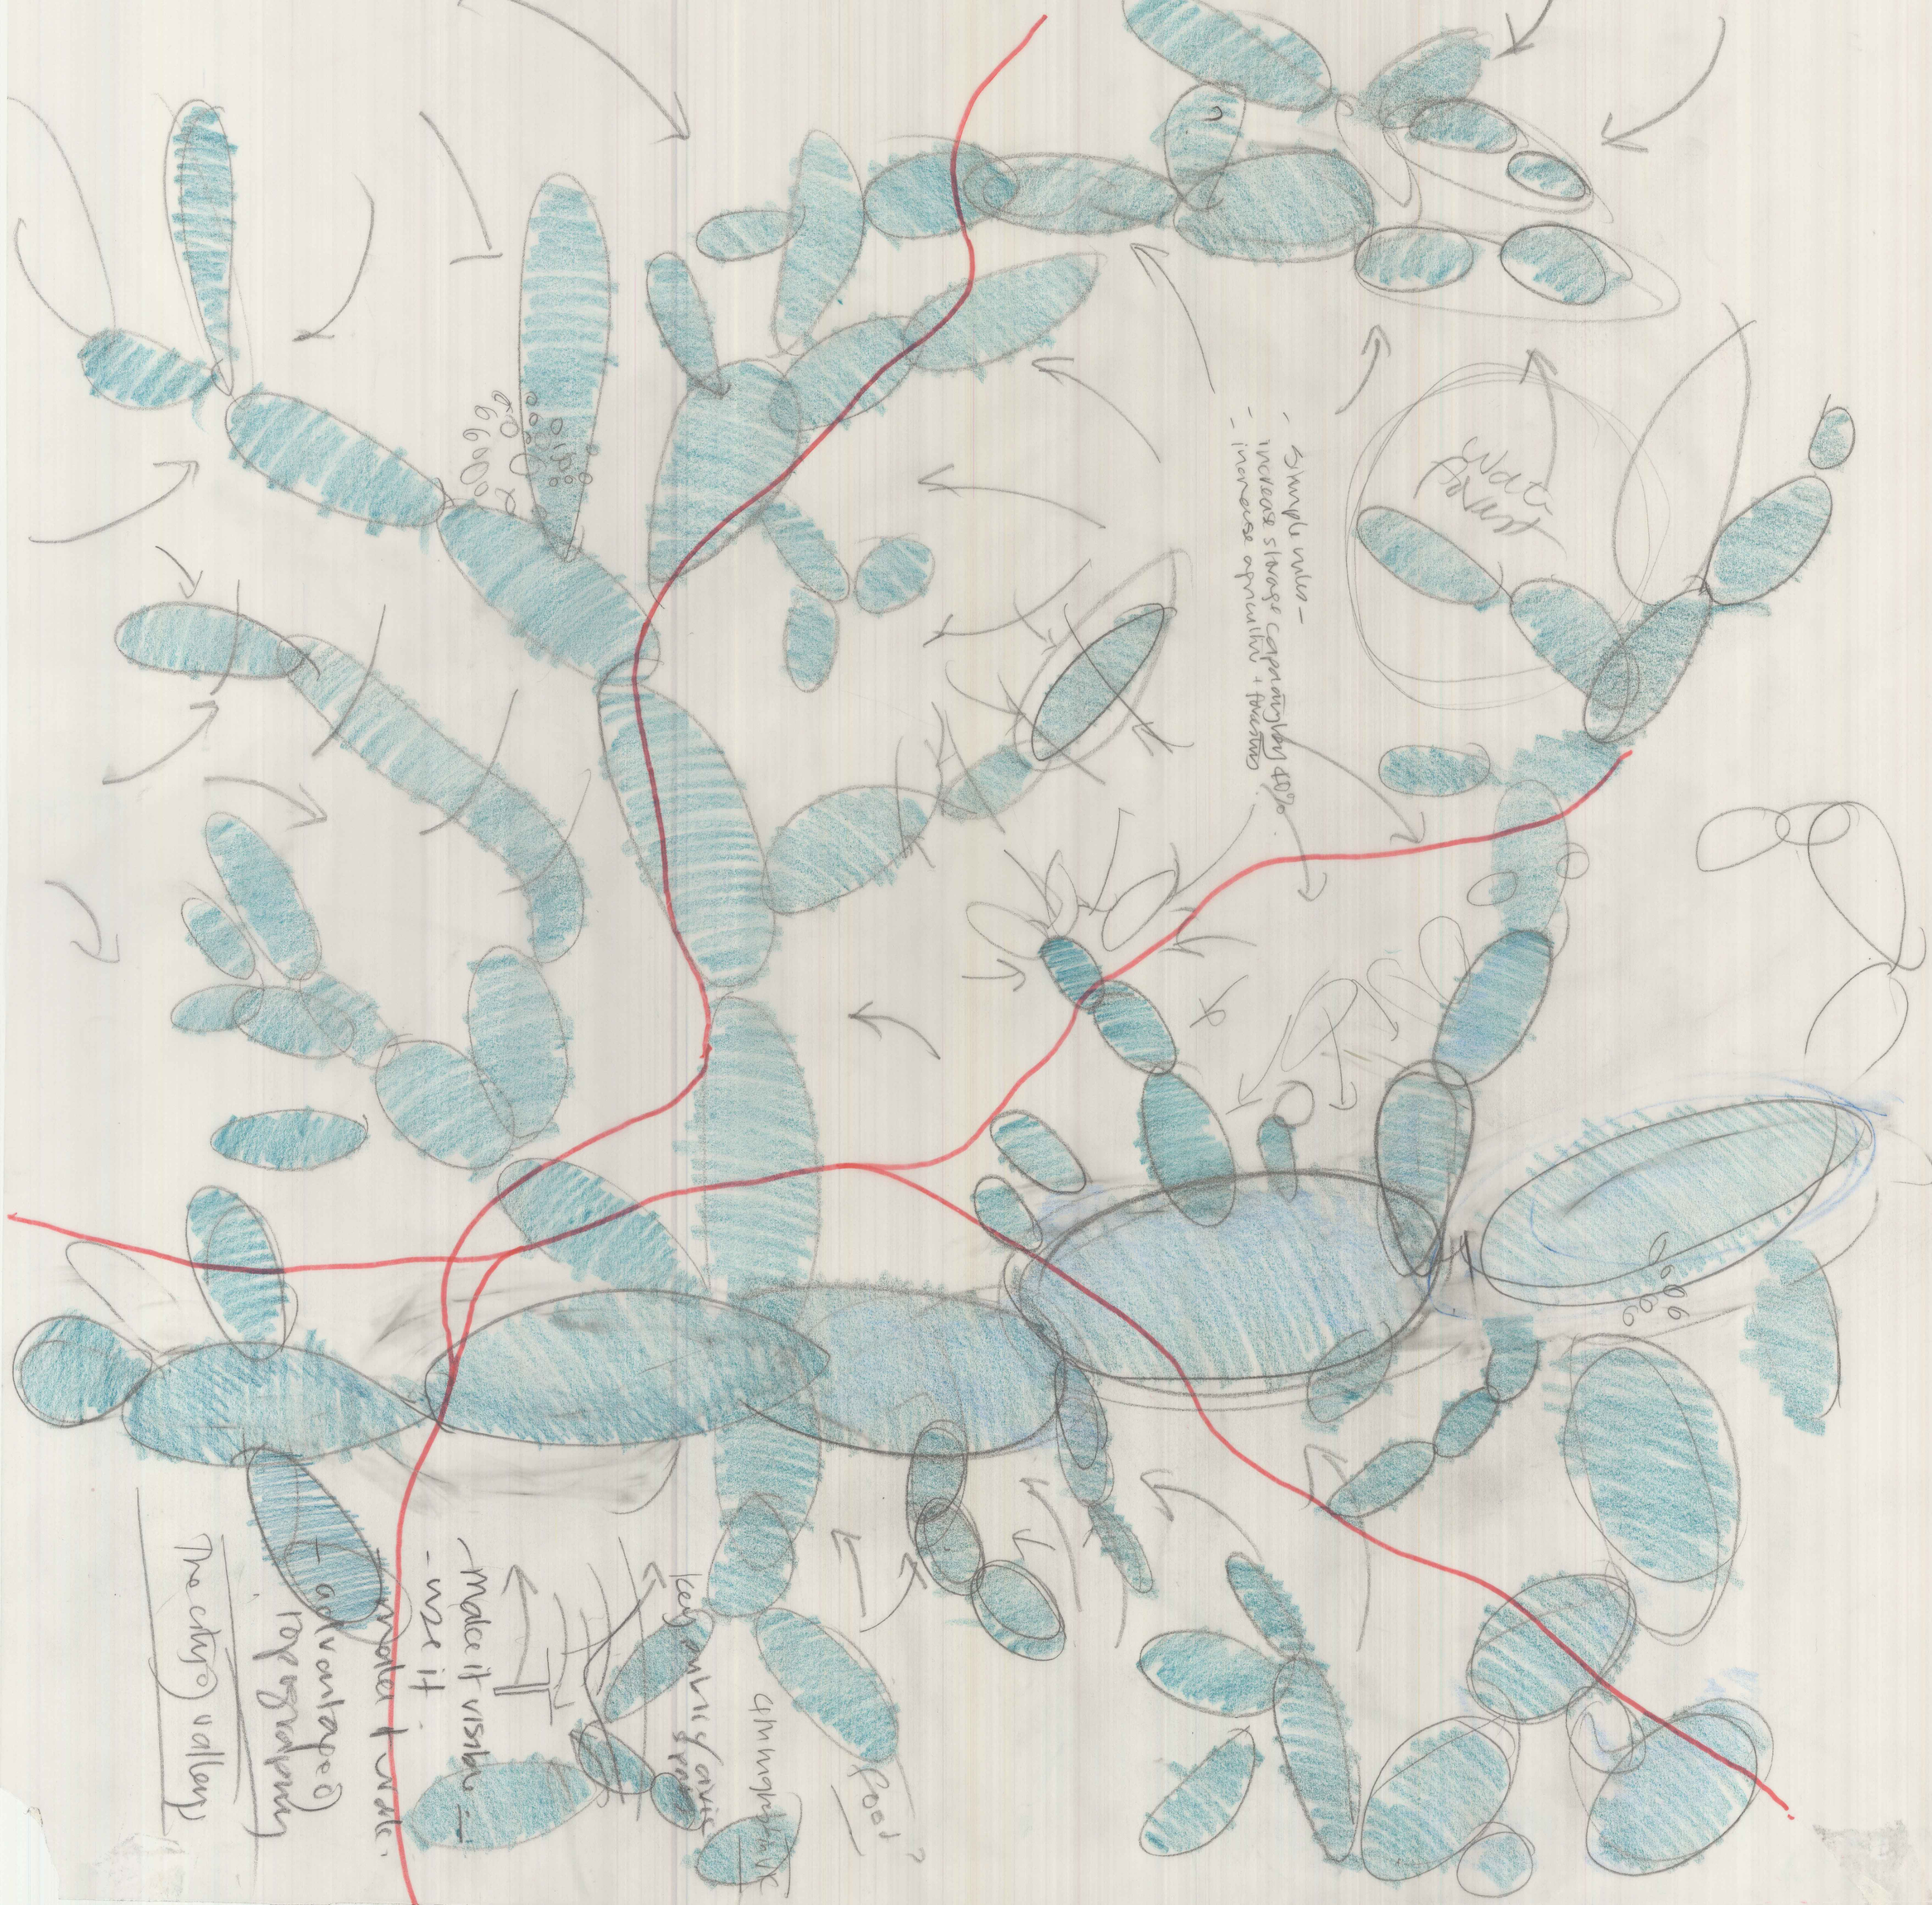

The Blue Bubble Diagram: The Tame Valley headwaters connecting the comunities of the region: Tame Valley Wetland Landscape Vision: the City of Valleys, 2016
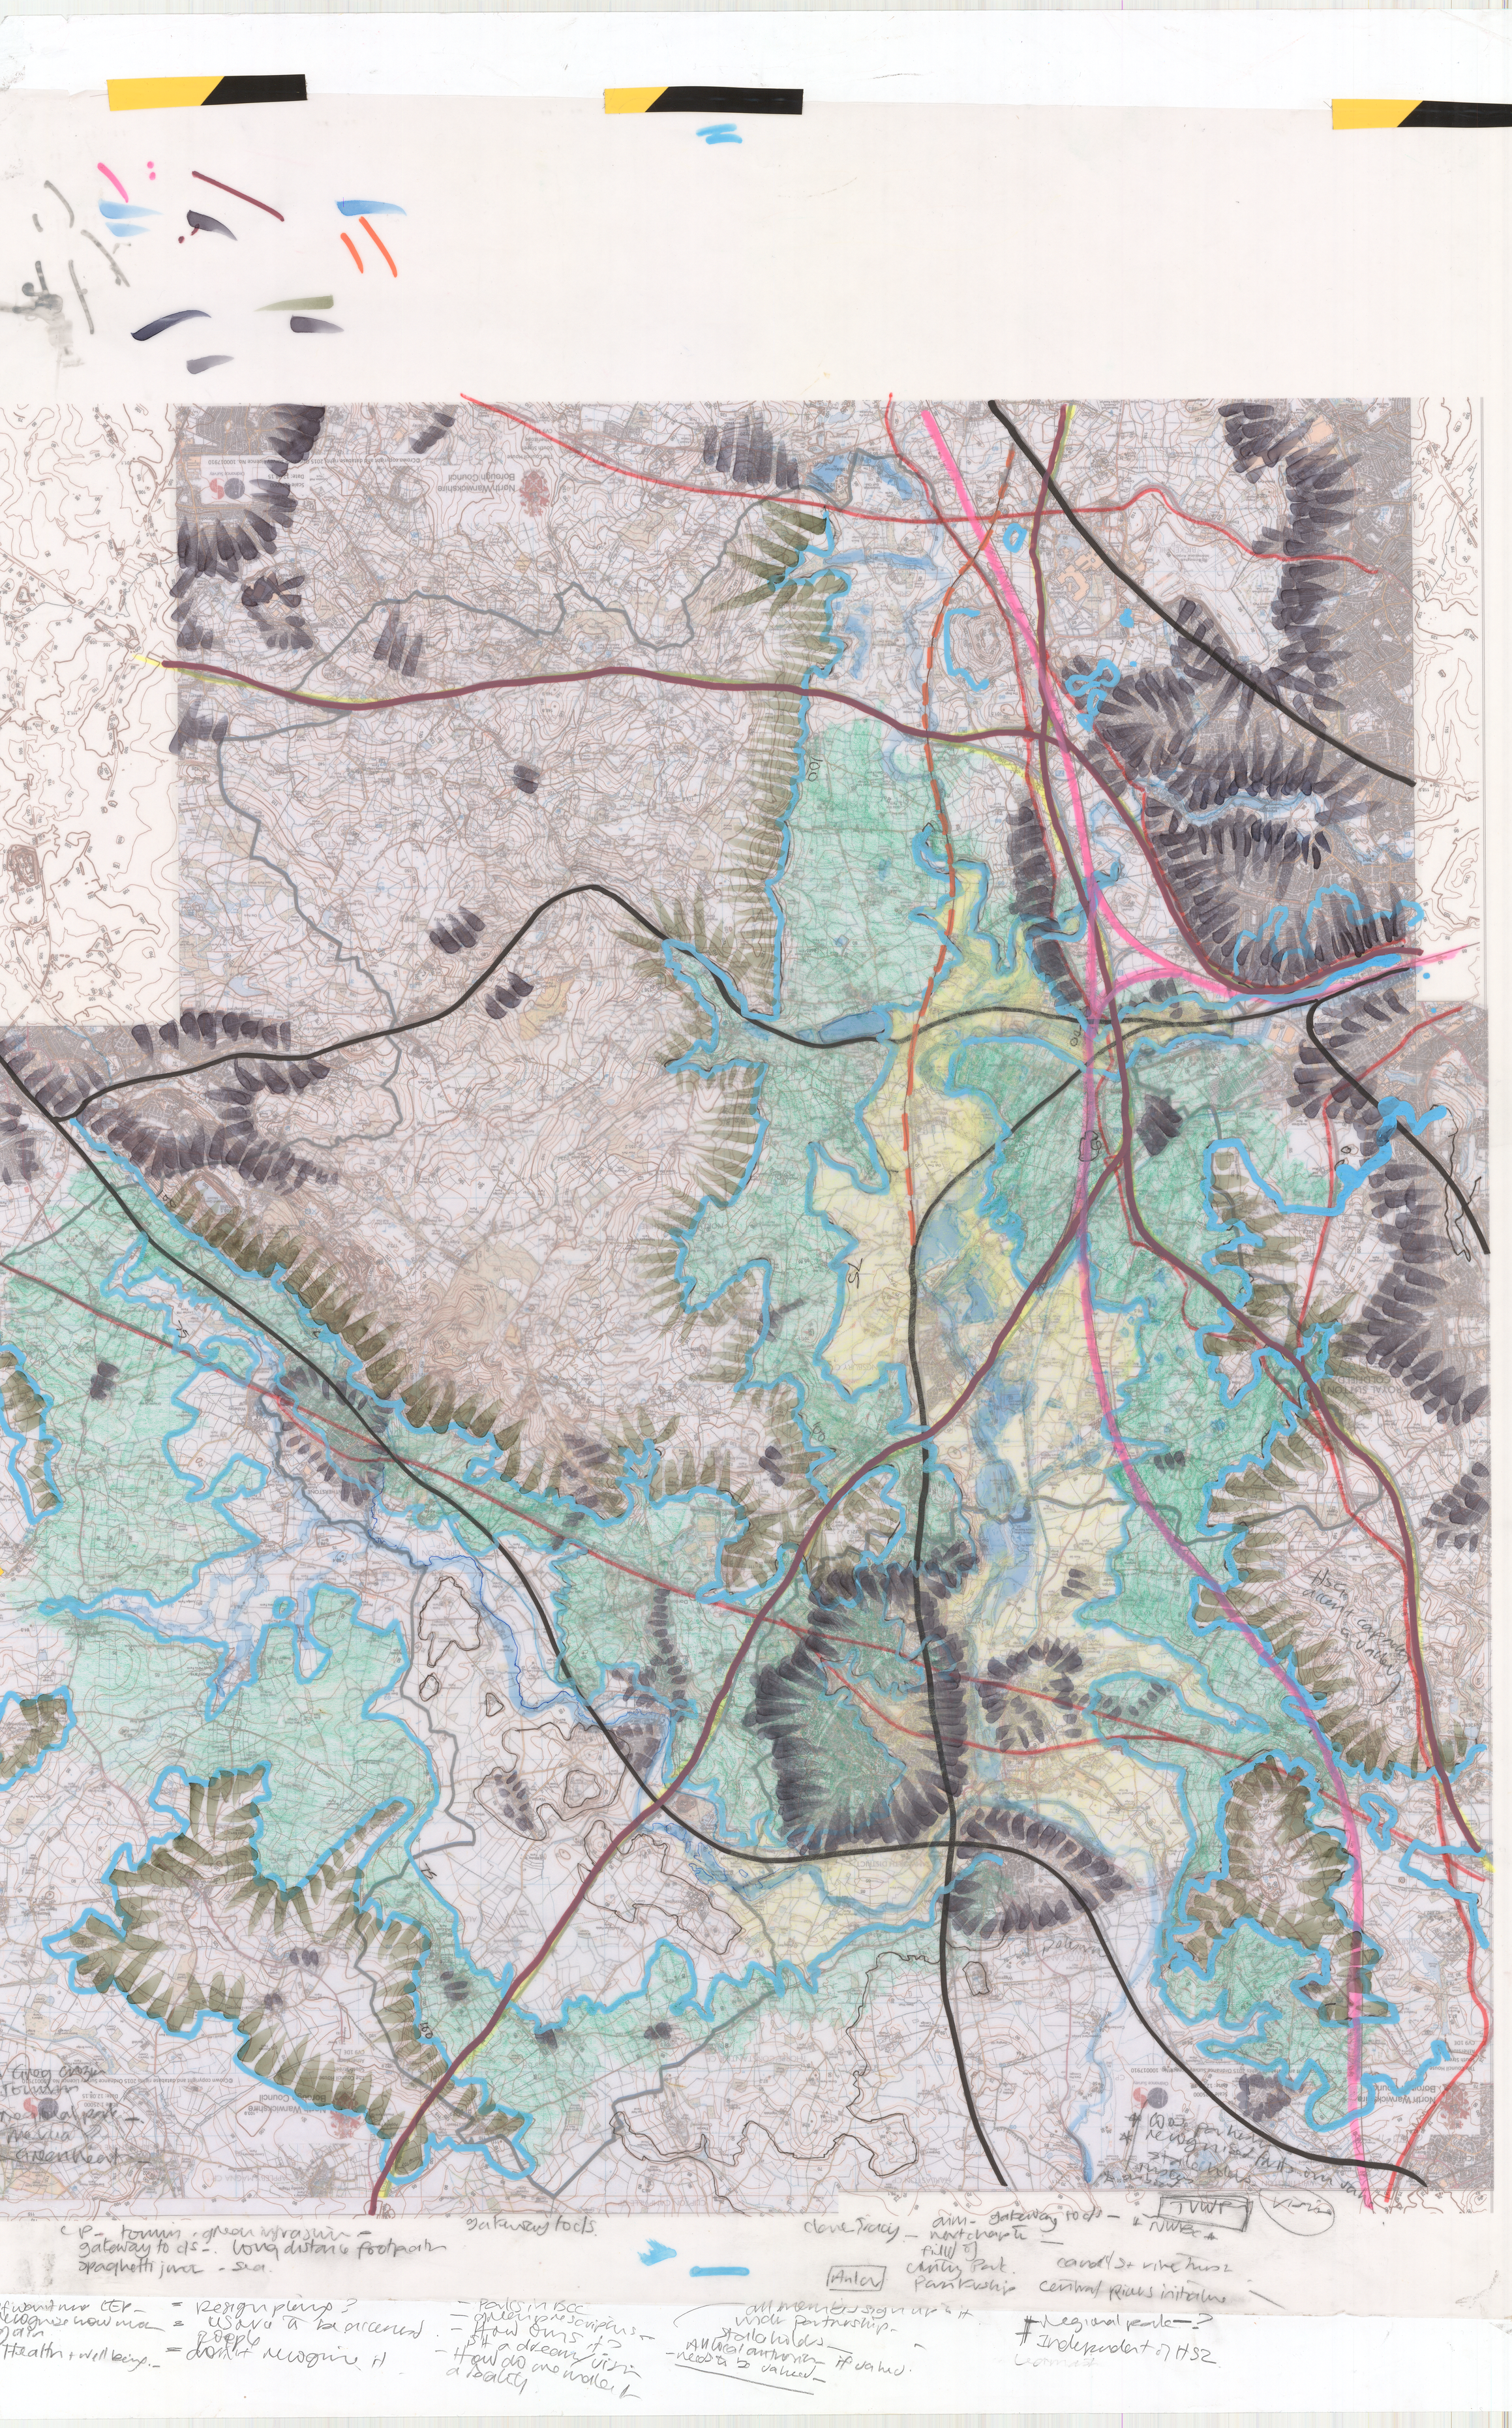
Tame Valley Wetland Landscape Vision: undererstanding the relationship between the canals, the river valleys, woodland remnants and the built environment, 2016
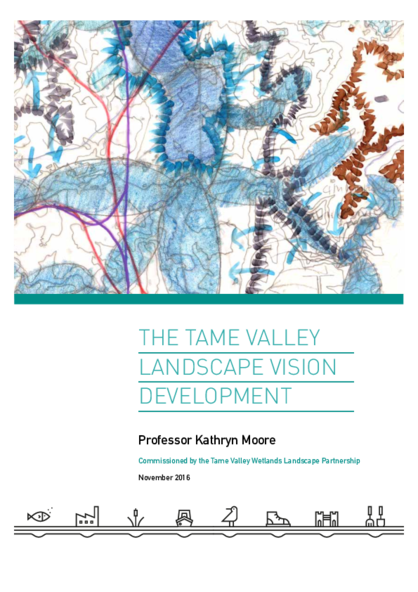
Understanding the relationship between flood plain the conurbation and transport infrastructure: Tame Valley Wetland Landscape Vision, 2016
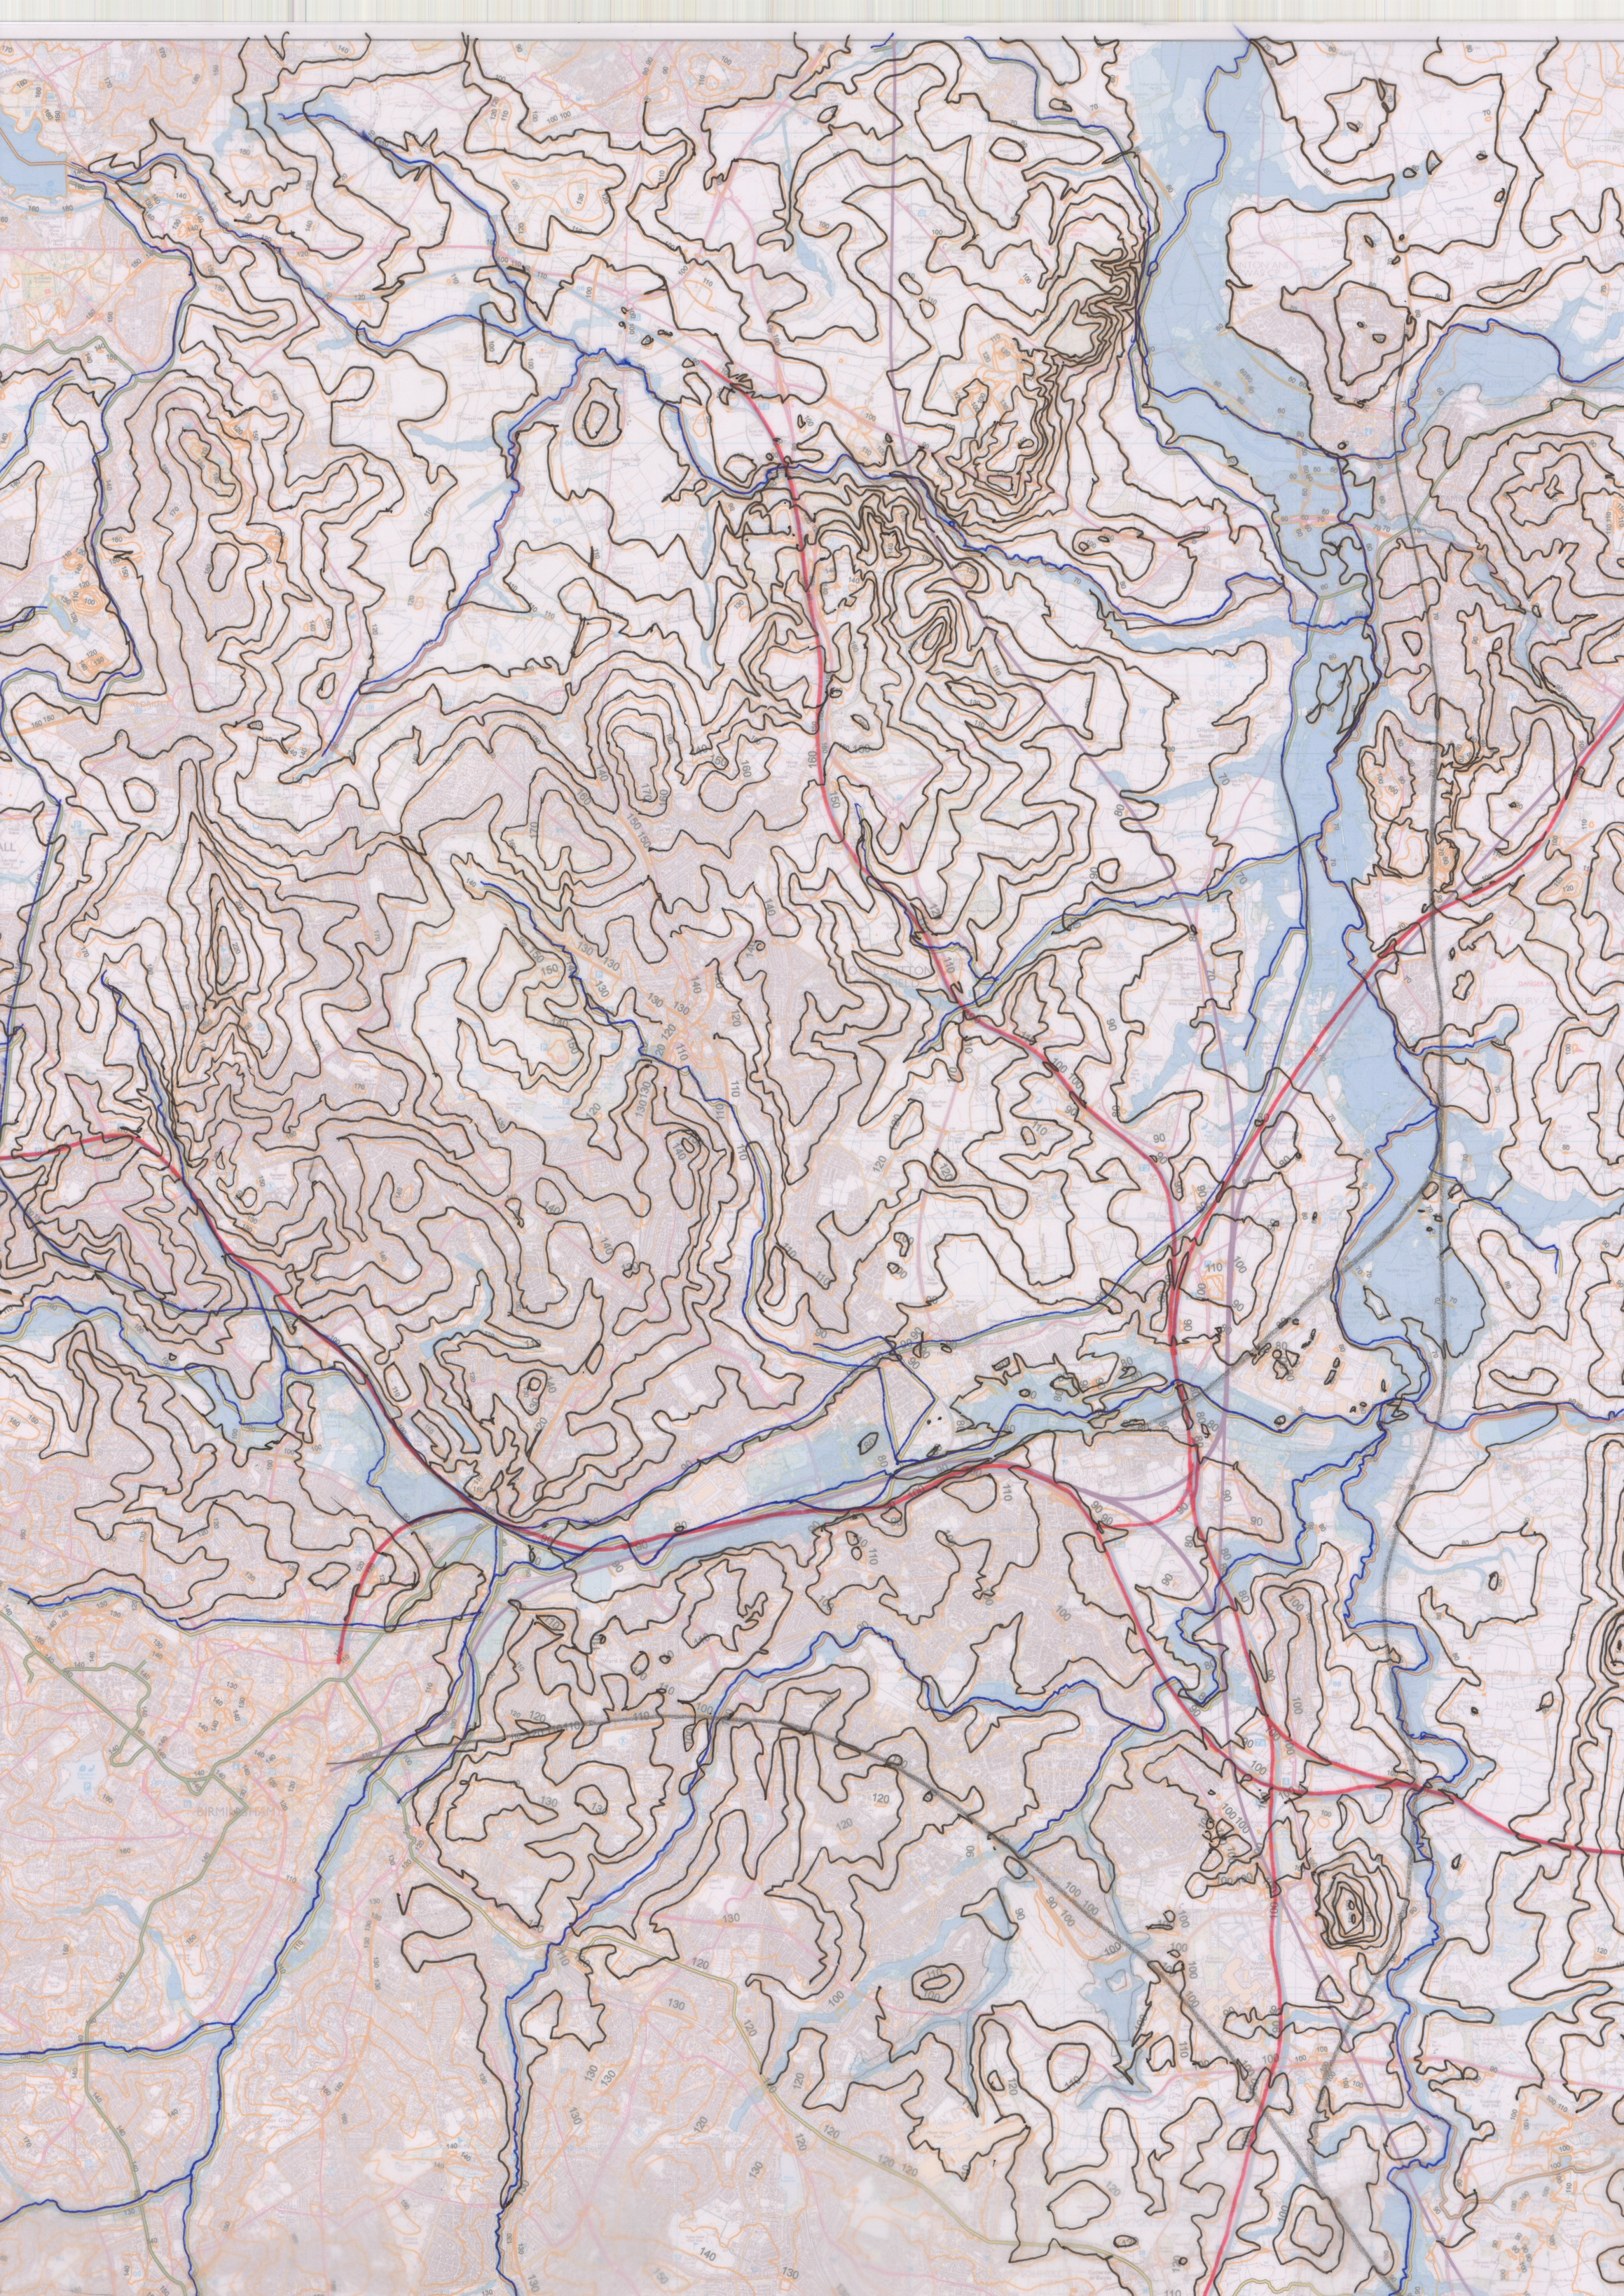
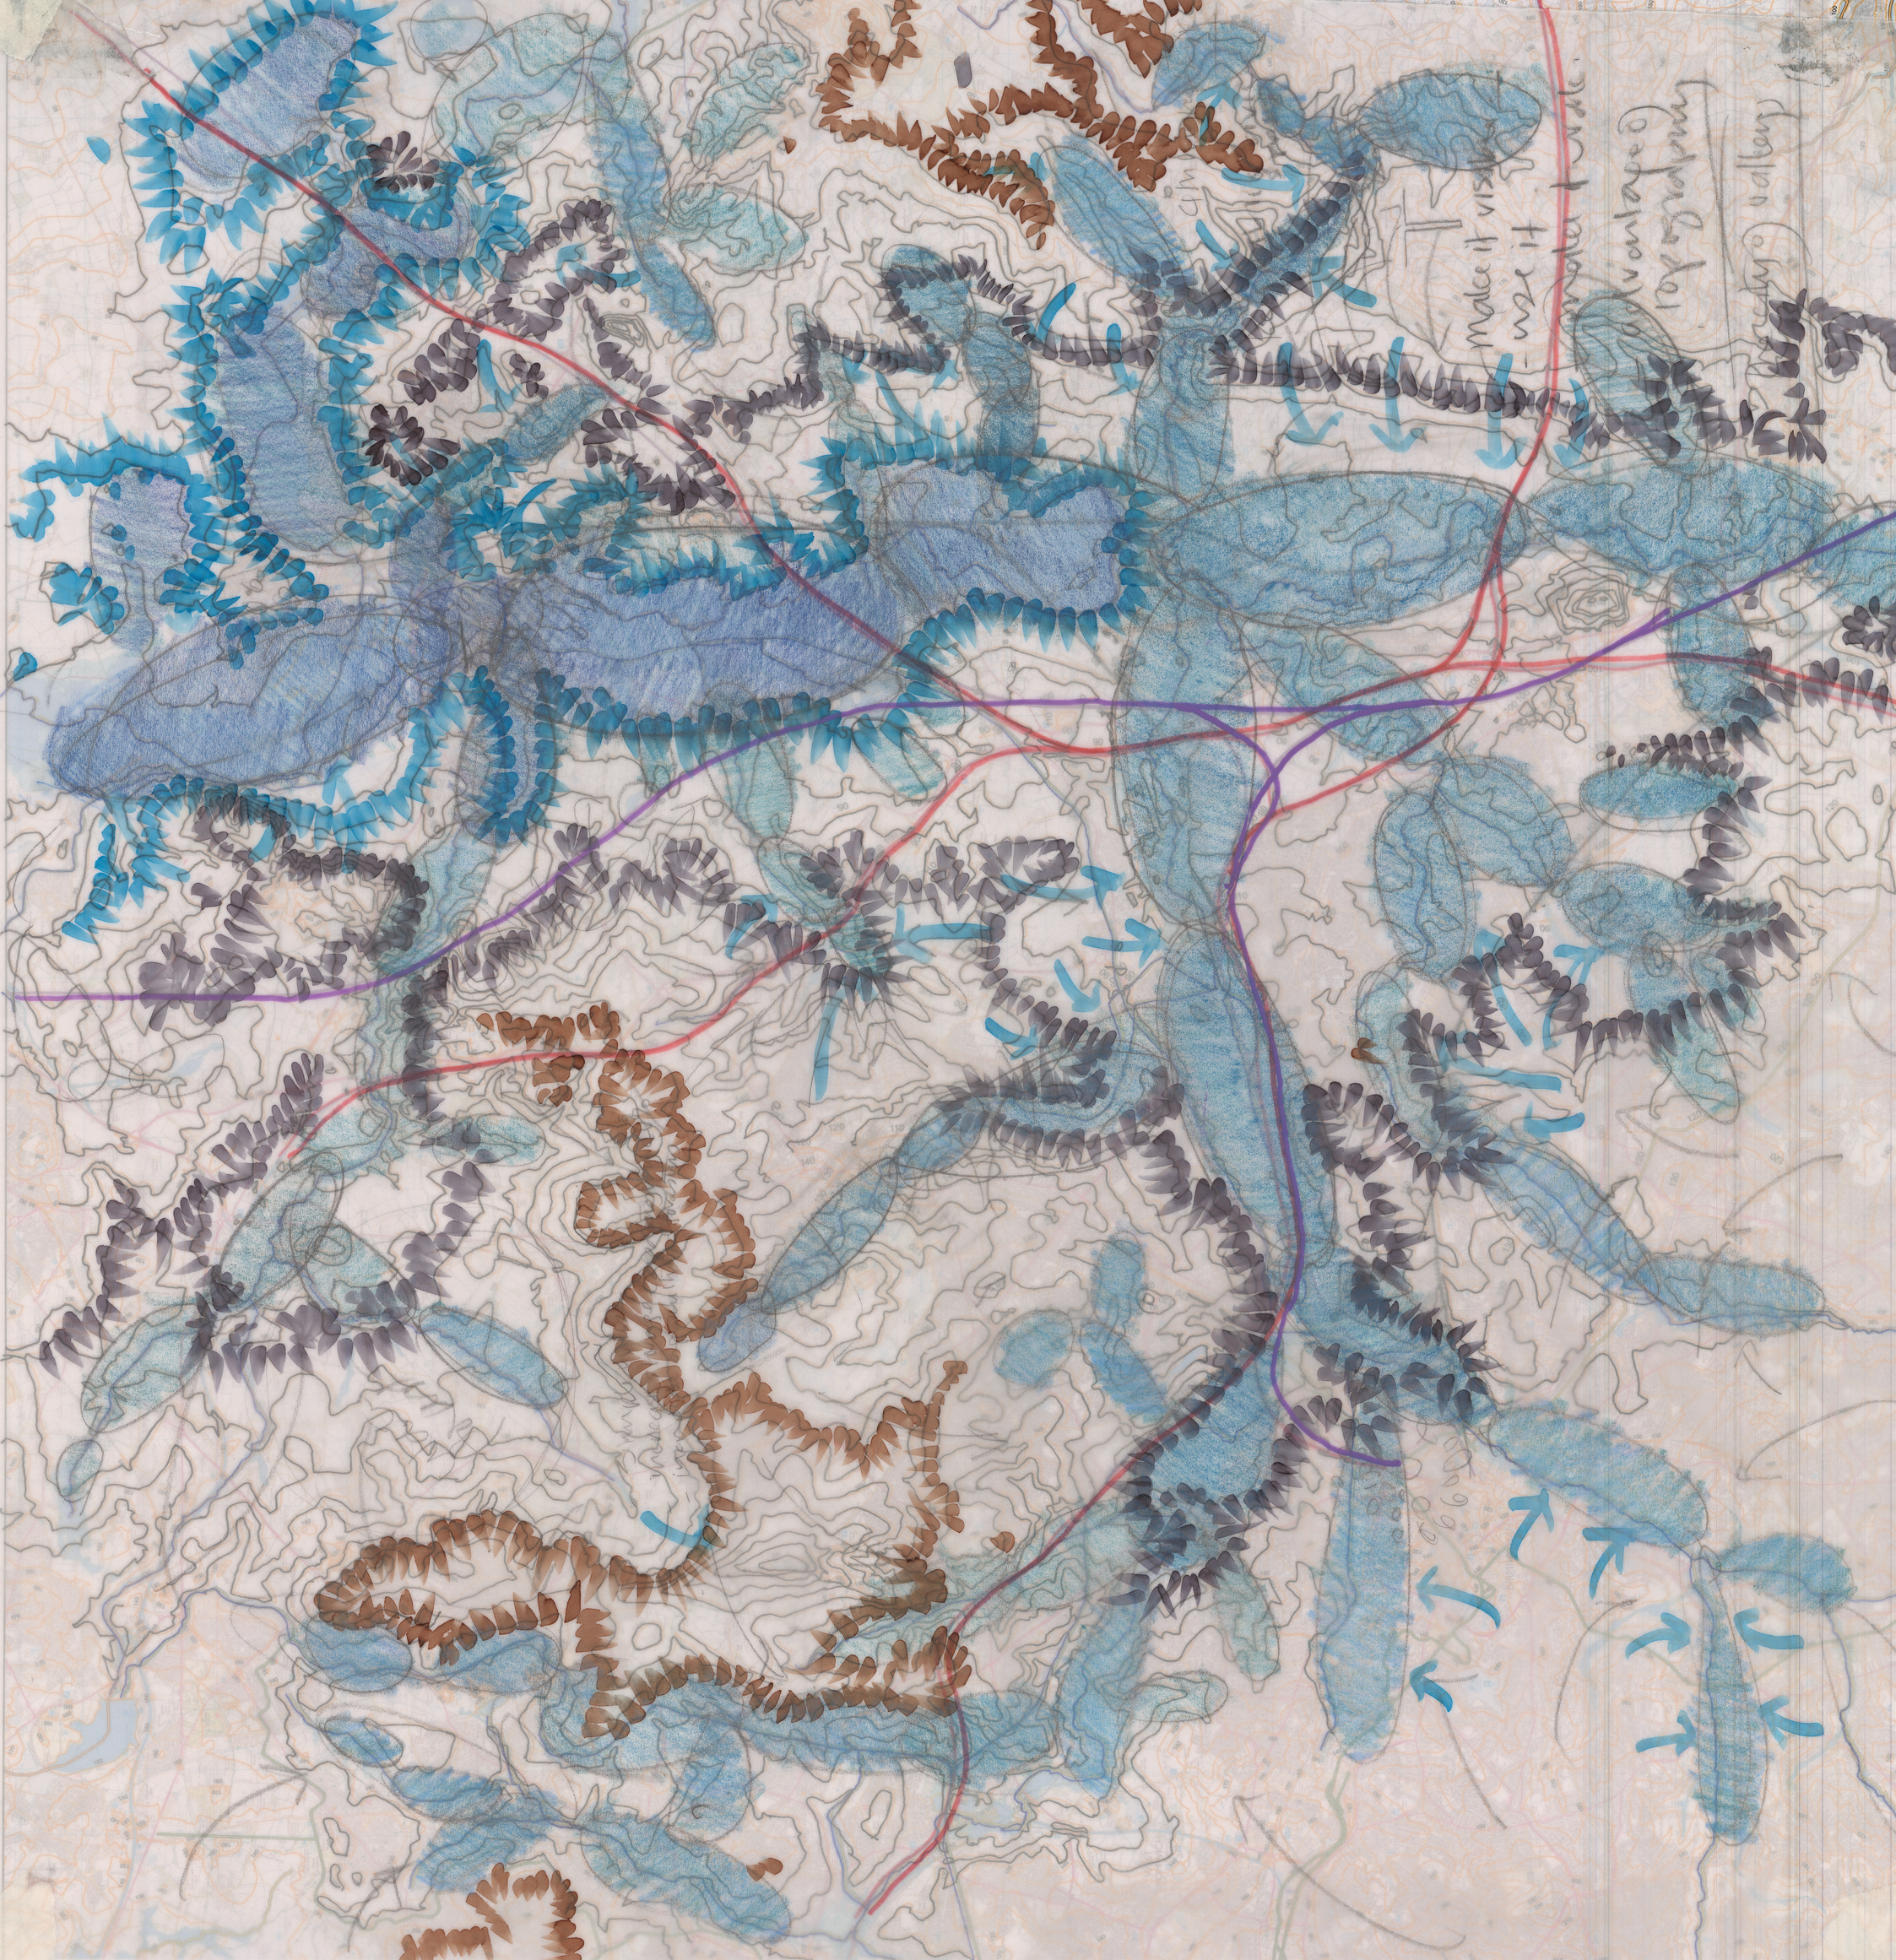
Tame Valley Wetland Landscape Vision: topography and infrastructure over blue bubbles, contours and OS map, 2016
"It's the equivalent of discovering Birmingham's Pyramids" (Director of Public Health Birmingham, 2016)
1. WEST MIDLANDS NATIONAL PARK ORIGINALS
3. WEST MIDLANDS NATIONAL PARK PROSPECTUS & CONFERENCE PUBLICATIONS
4. WEST MIDLANDS NATIONAL PARK EXHIBITION
5. TAME VALLEY LANDSCAPE VISION
6. HS2 CURZON STREET CITY CENTRE PARK PROPOSAL
10. BCU MA LANDSCAPE ARCHITECTURE WEST MIDLANDS NATIONAL PARK STUDENT WORK
High resolution images available
on request from Kathryn Moore
For all images: all rights reserved
(c) Kathryn Moore (2004-20).
Images or content may not be
reproduced without permission.